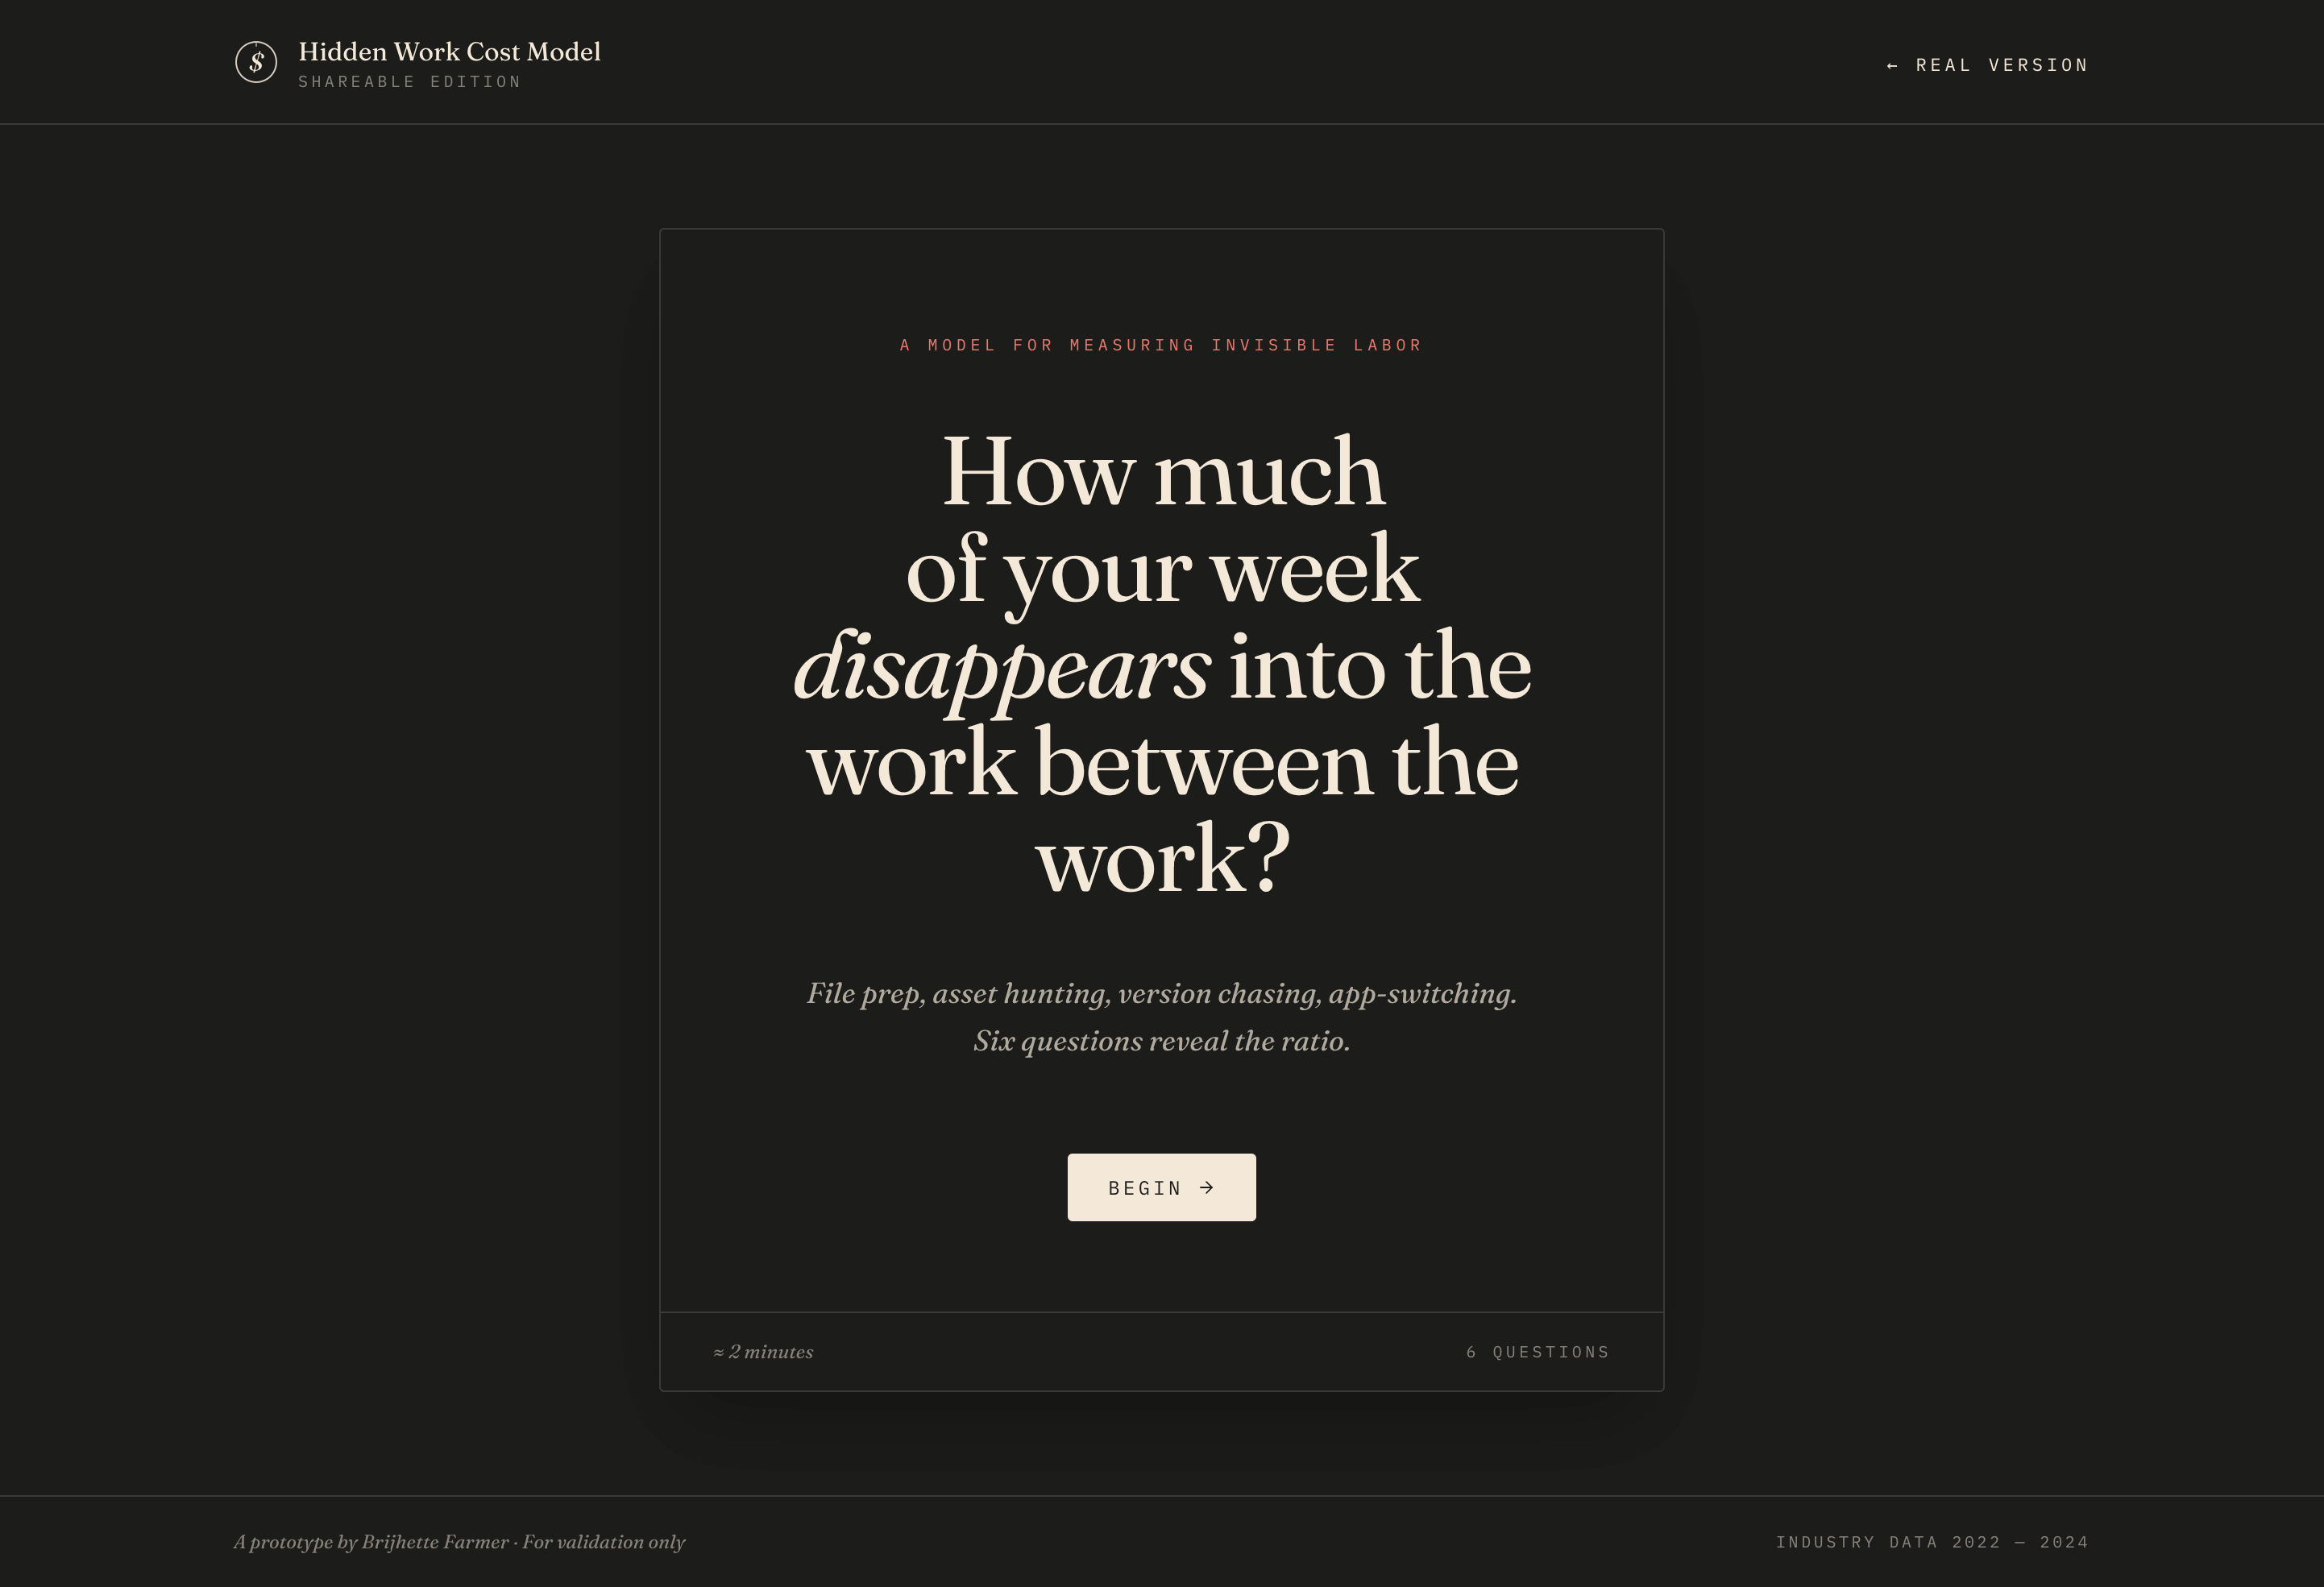
What was the central goal?
The question nobody was asking yet
Two directions were on the table: novel UI experiences that would demo well, or agentic workflows that actually solved the hidden work creatives have been complaining about for over a decade. The team needed a way to evaluate that tradeoff with real data. The deeper question was whether the cost of not solving hidden work could be made undeniable.
What I built
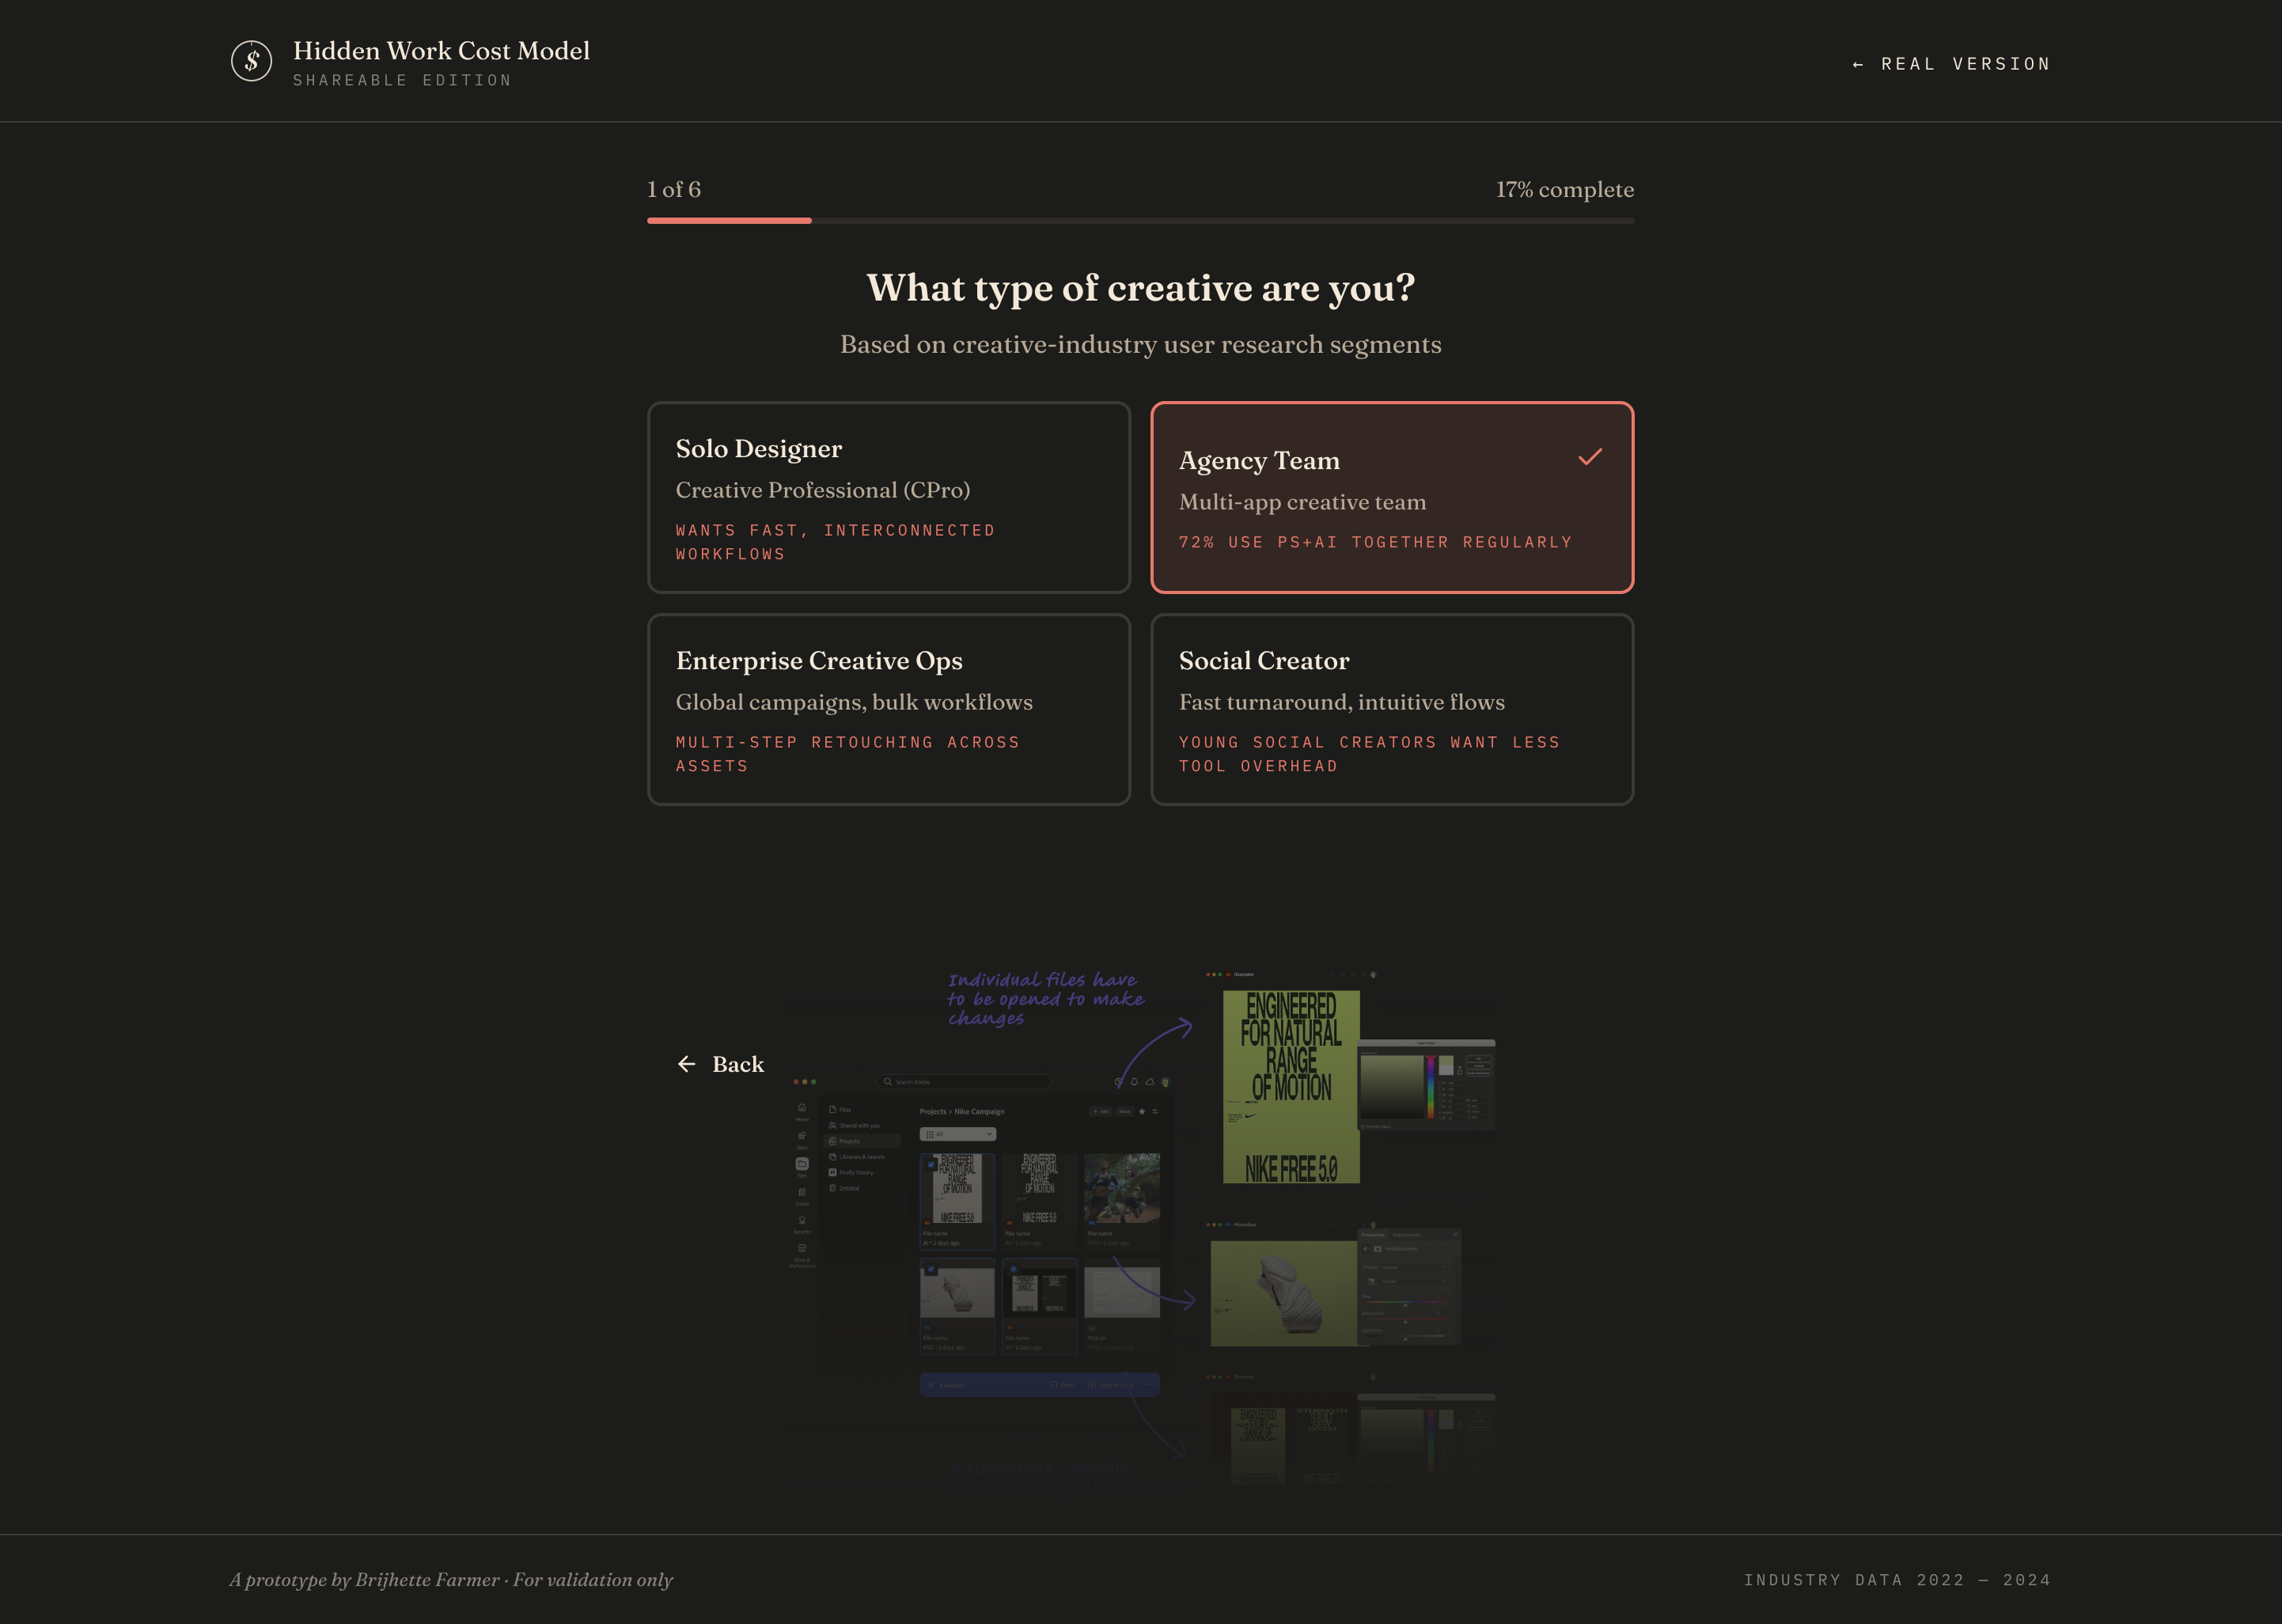
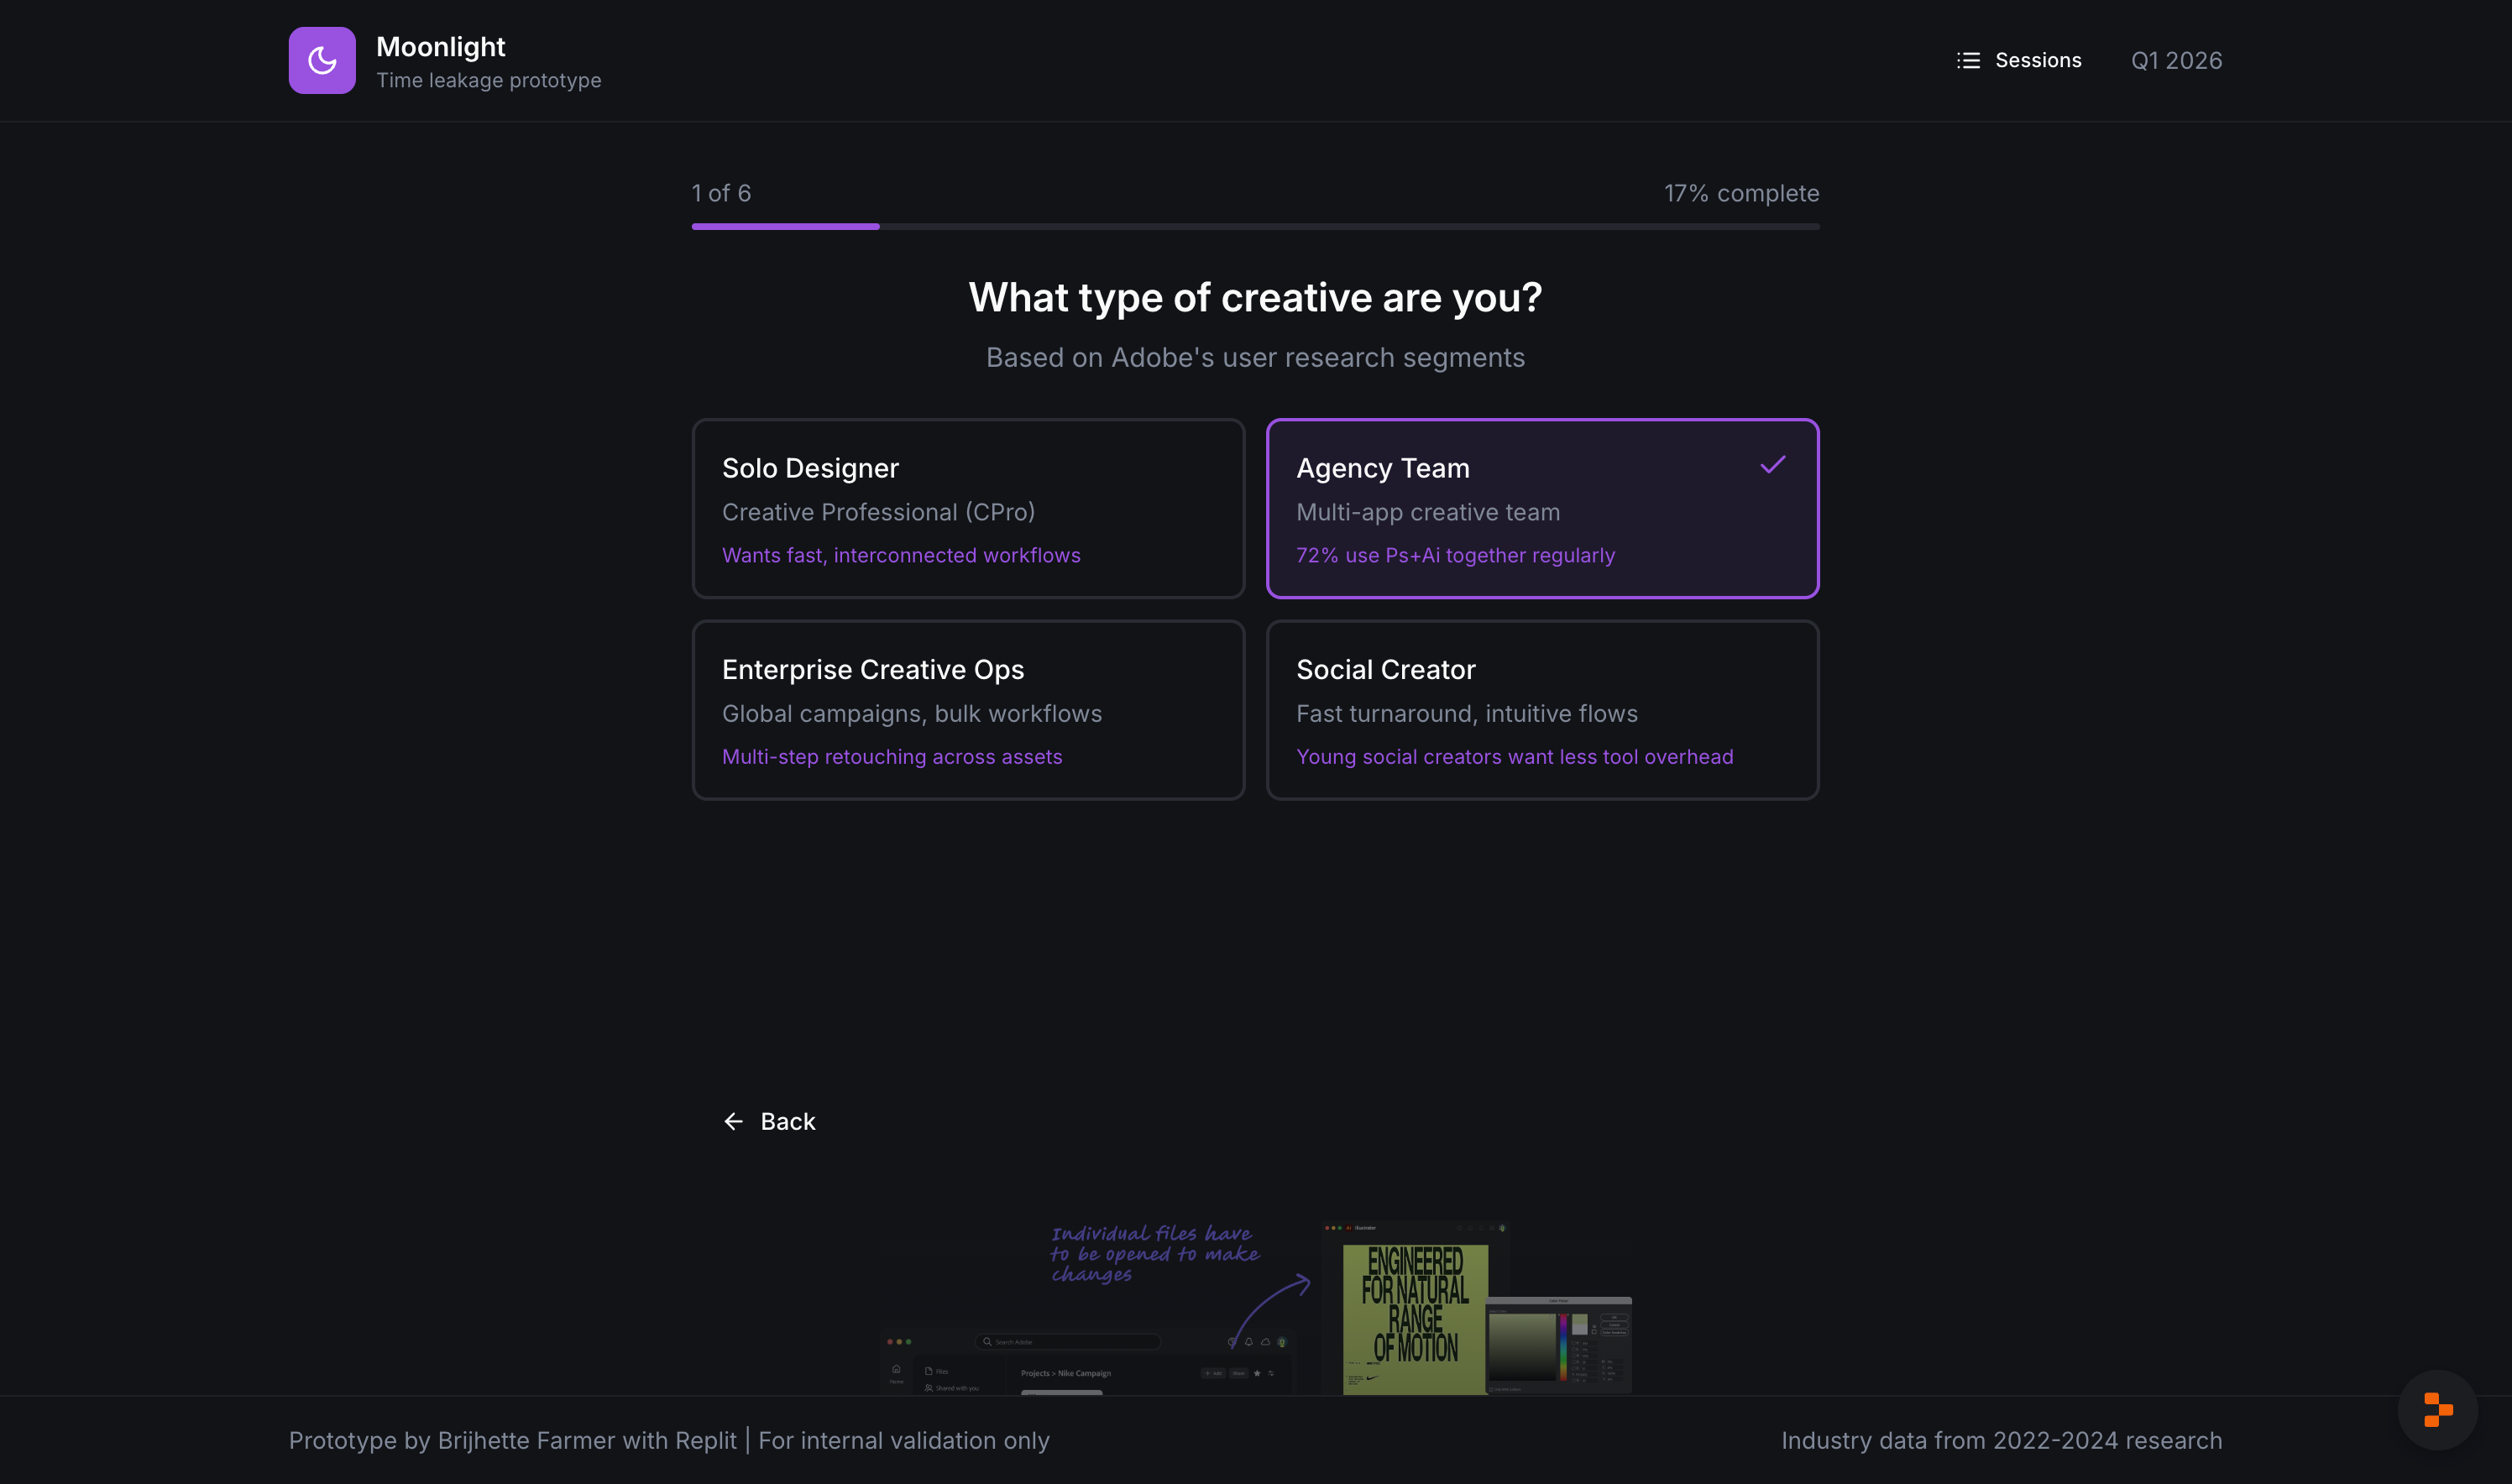
A full six-page interactive application built in Replit (React + TypeScript + Express) that functions as both a user-facing research instrument and a strategic argument engine. The tool draws on internal Adobe research, external creative workflow studies dating back to 2018, and real subscription cost data across four creative contexts: solo creative professional, agency team, enterprise creative ops, and social creator. All financial data in the screenshots is for demo purposes only.
Three layers of argument.
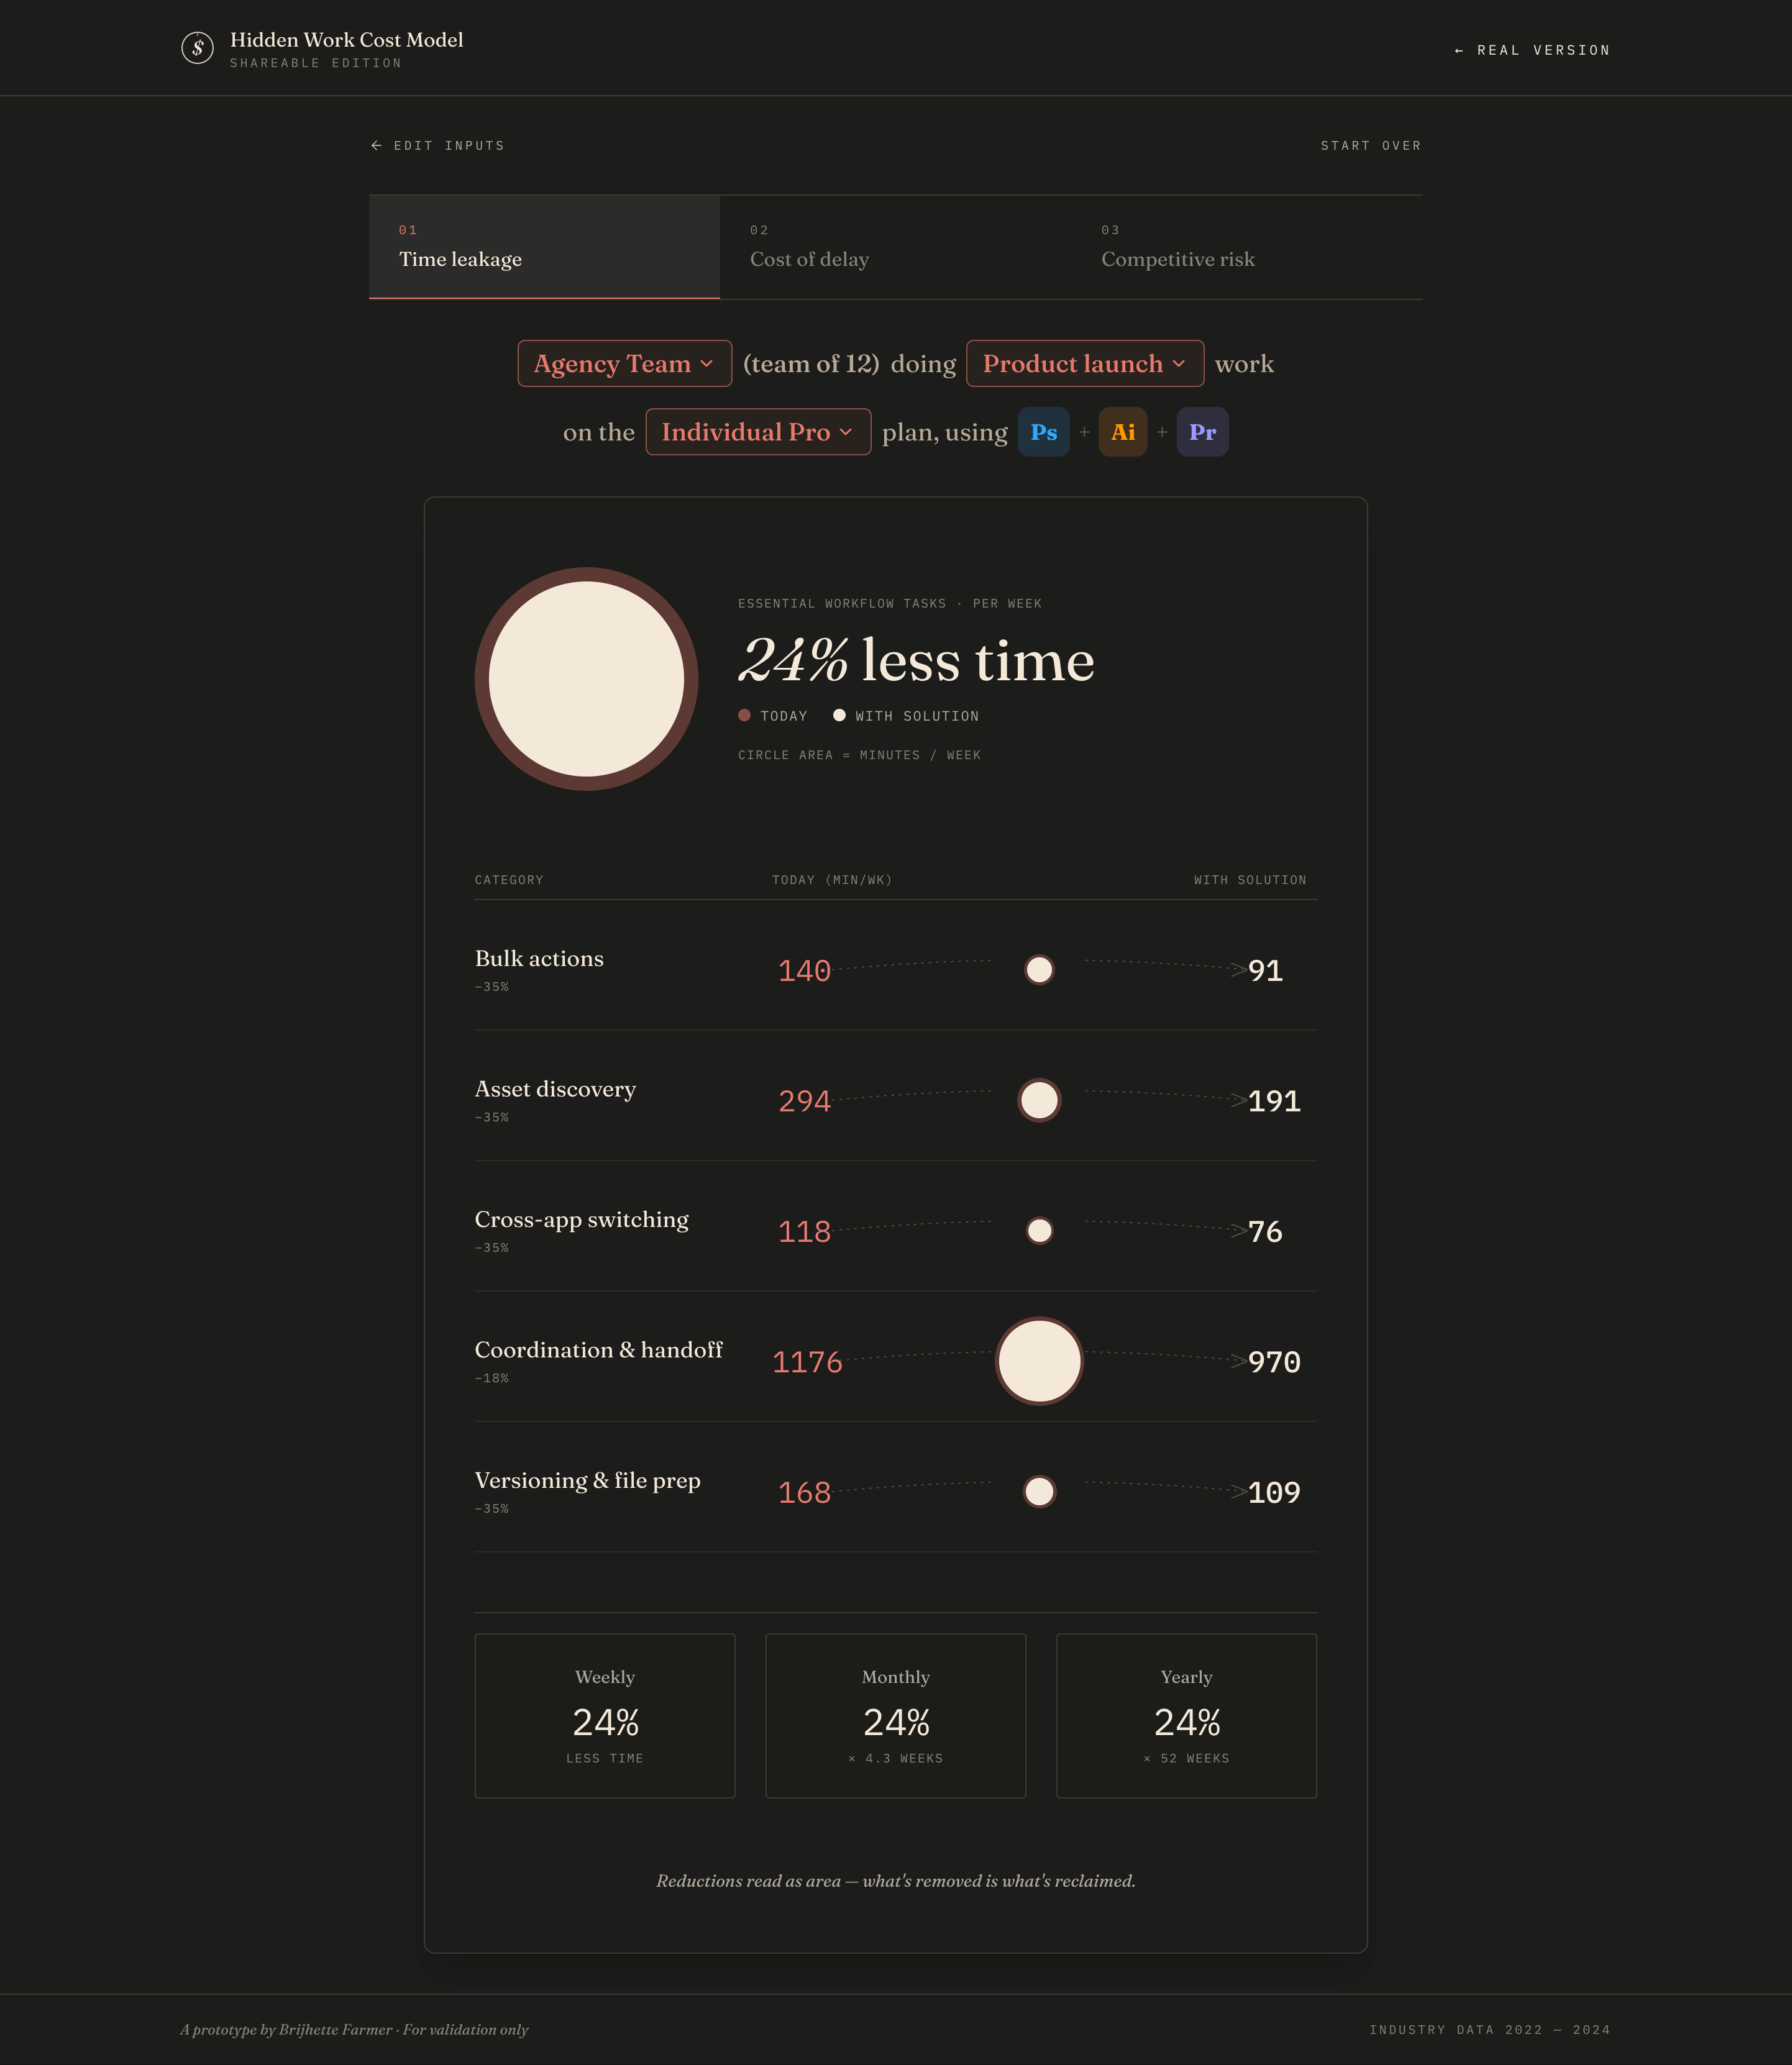
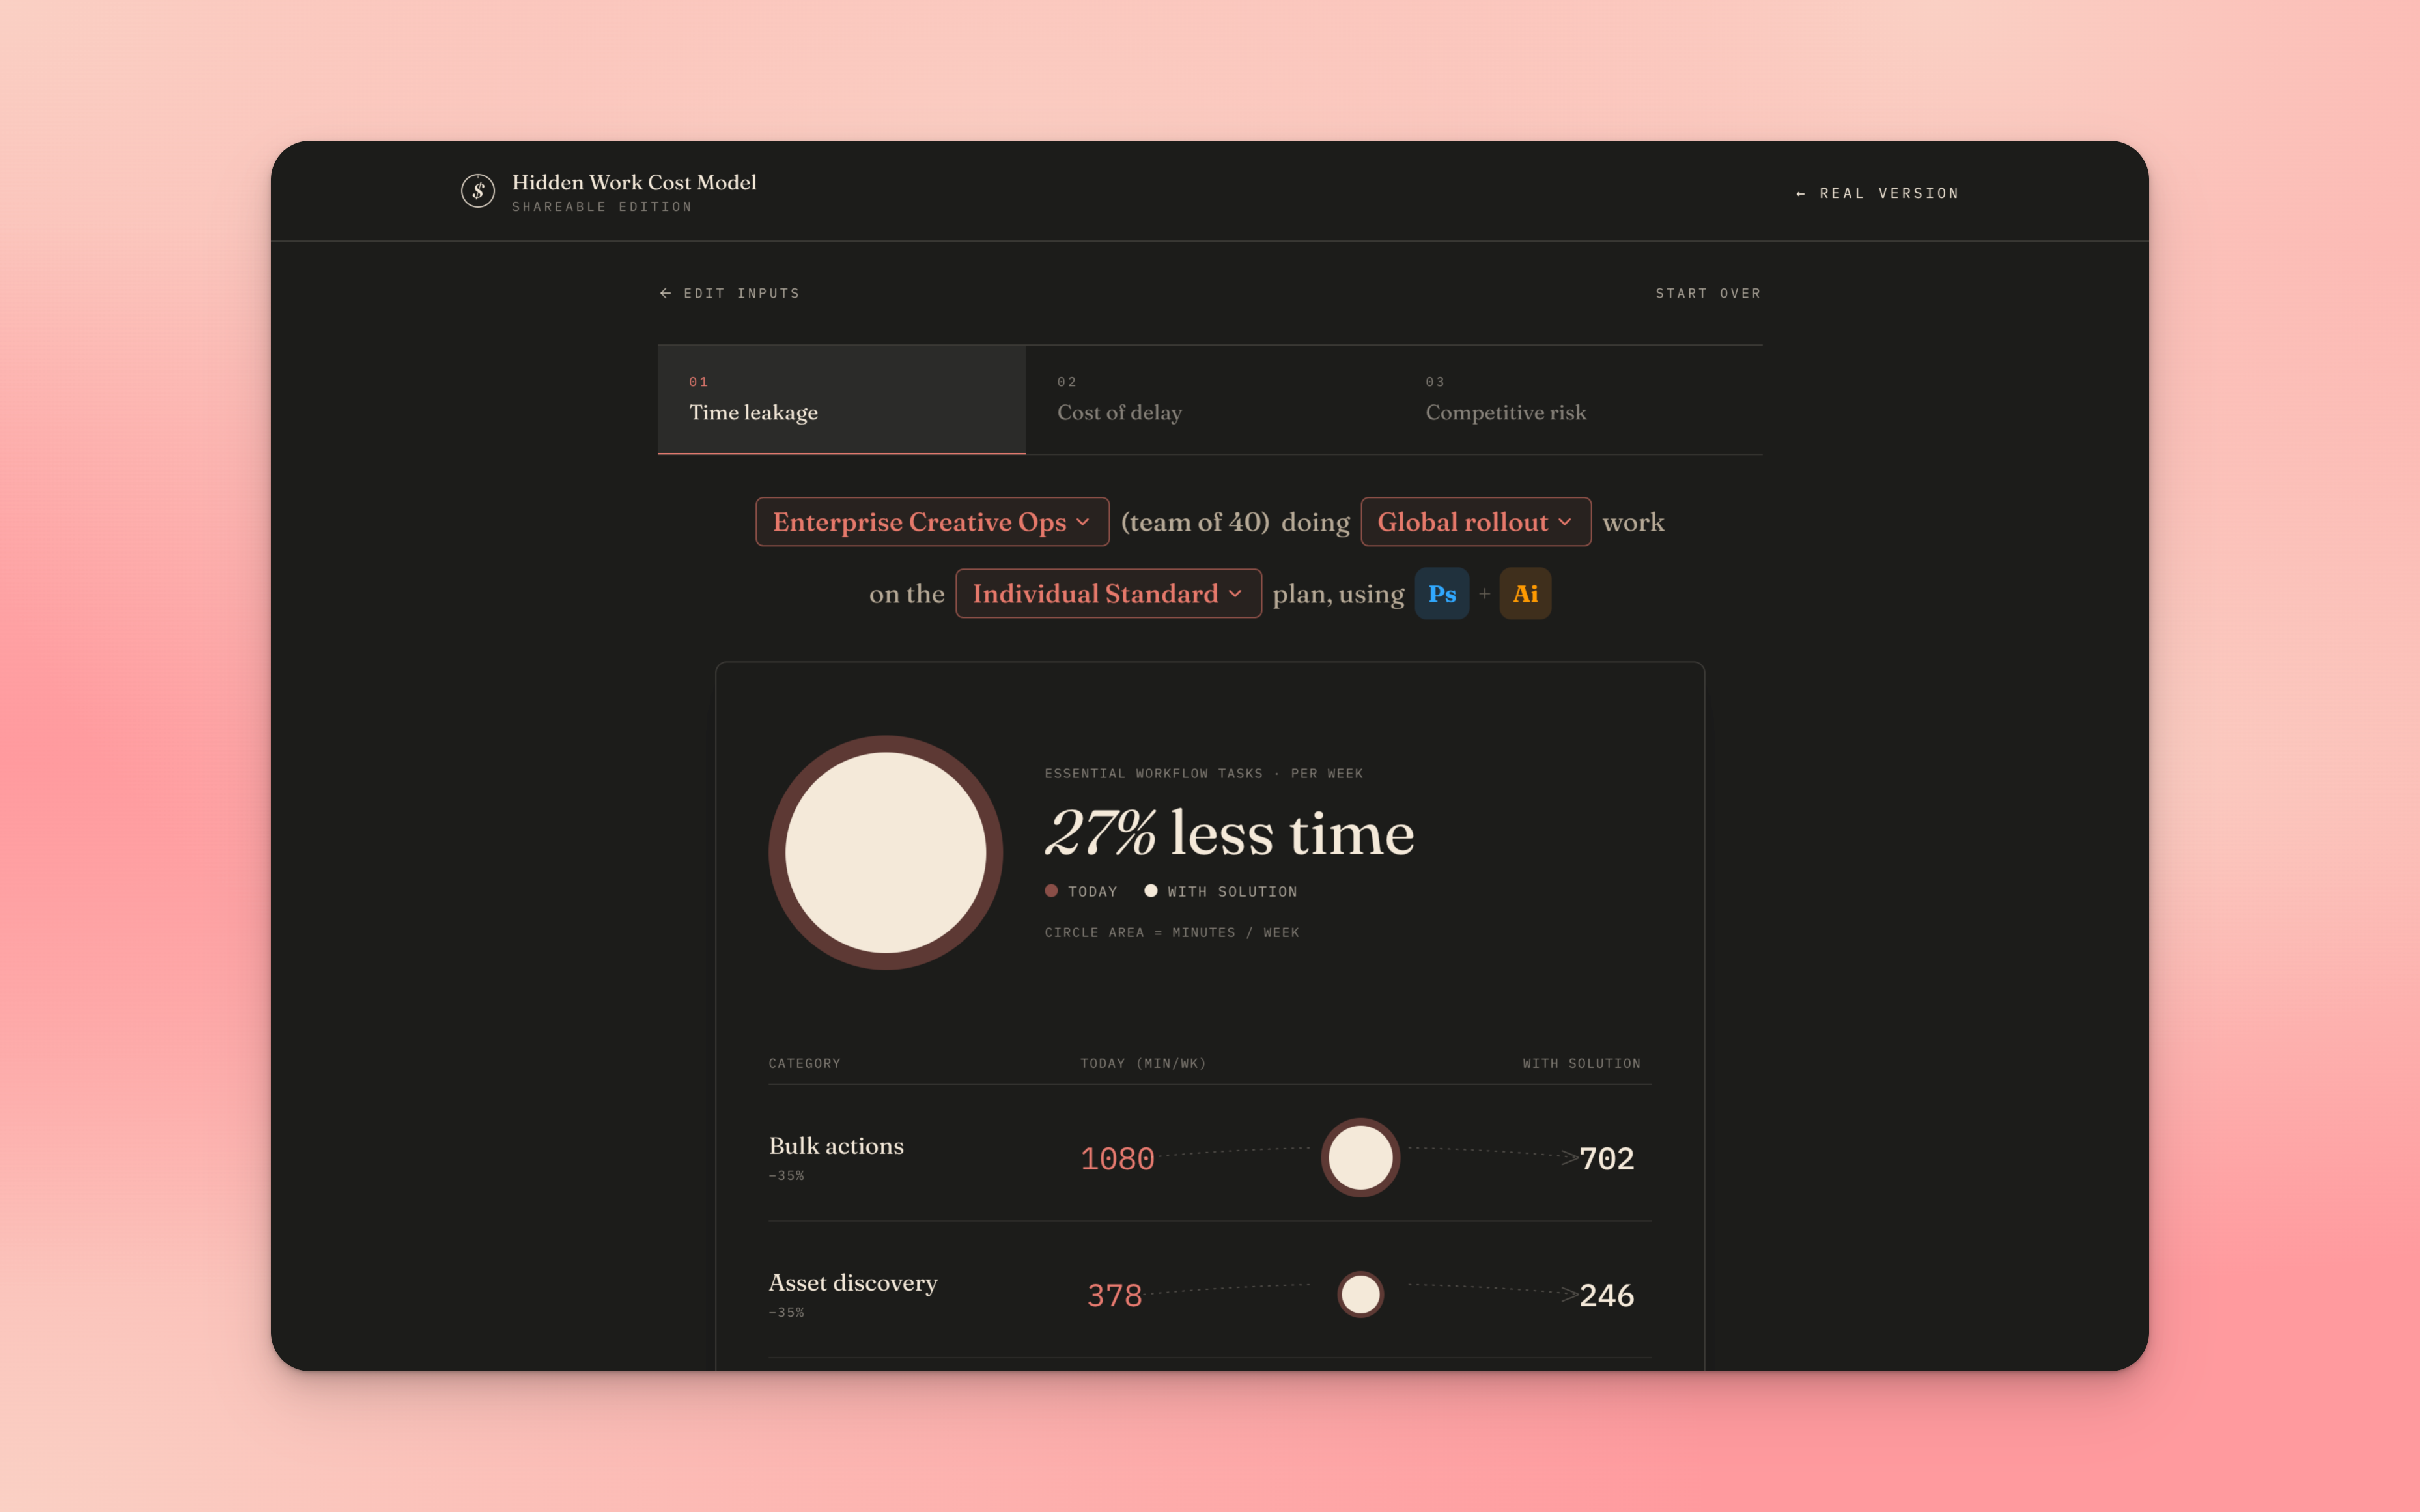
Time leakage.
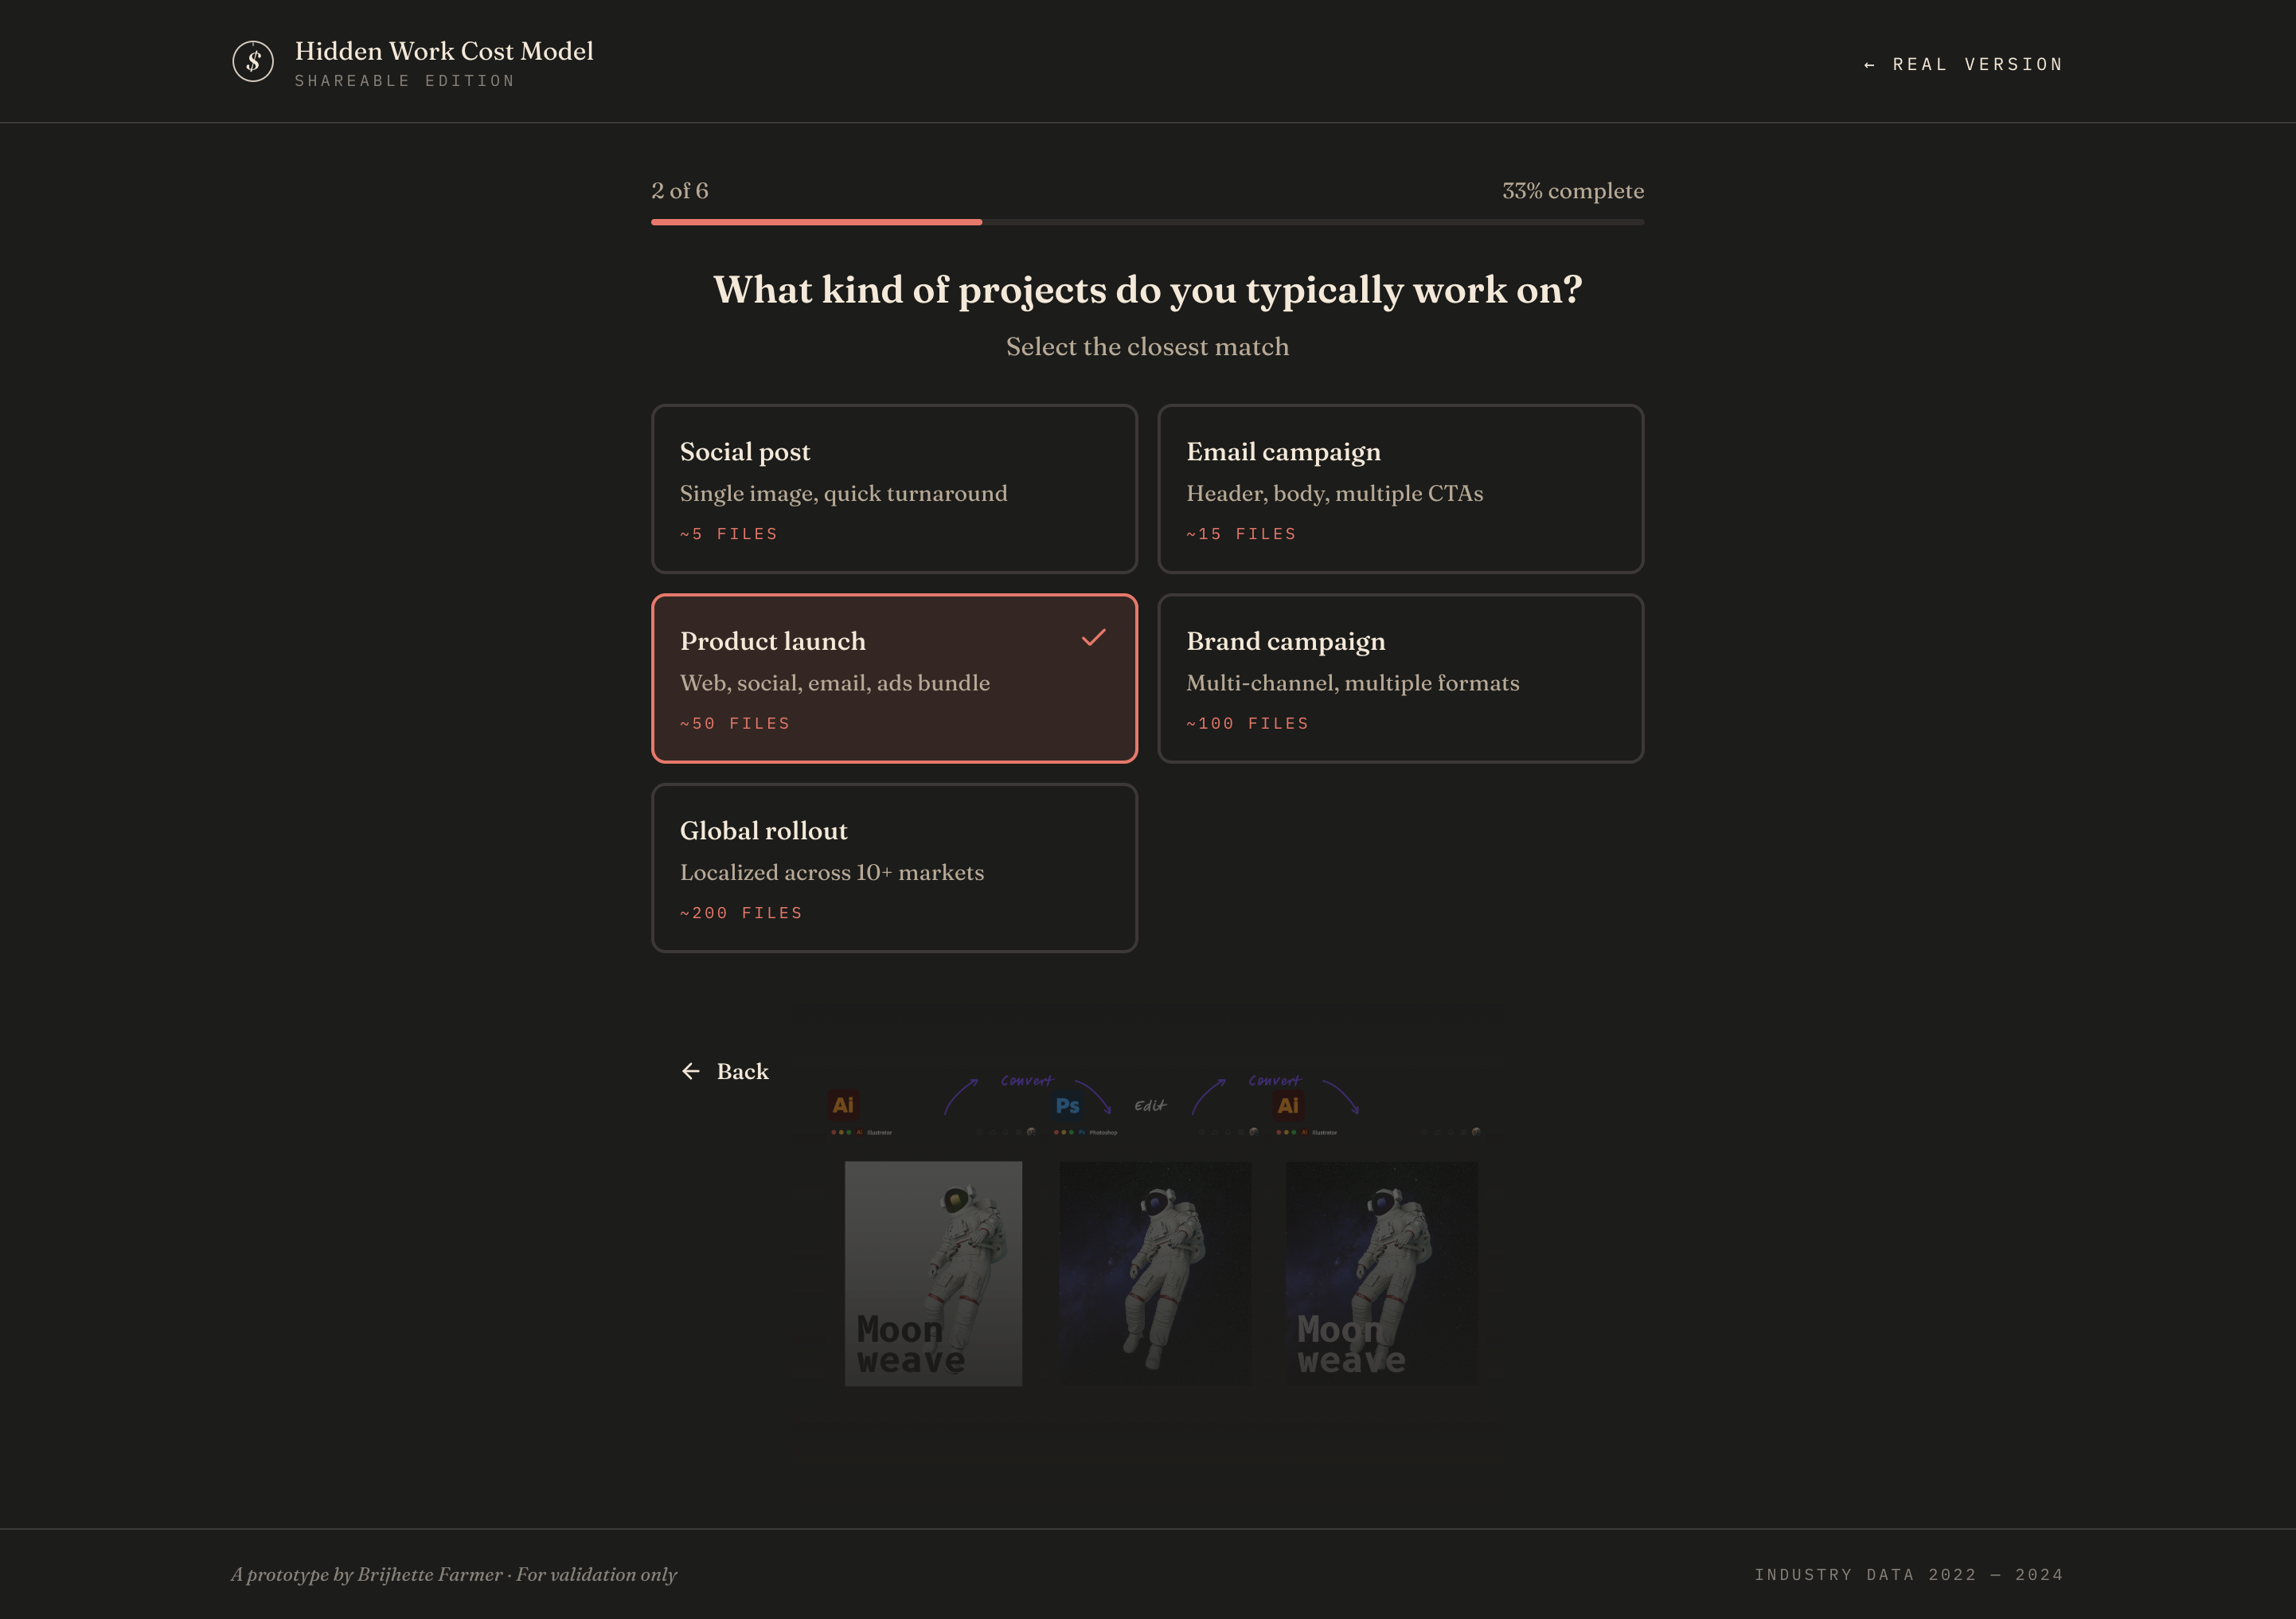
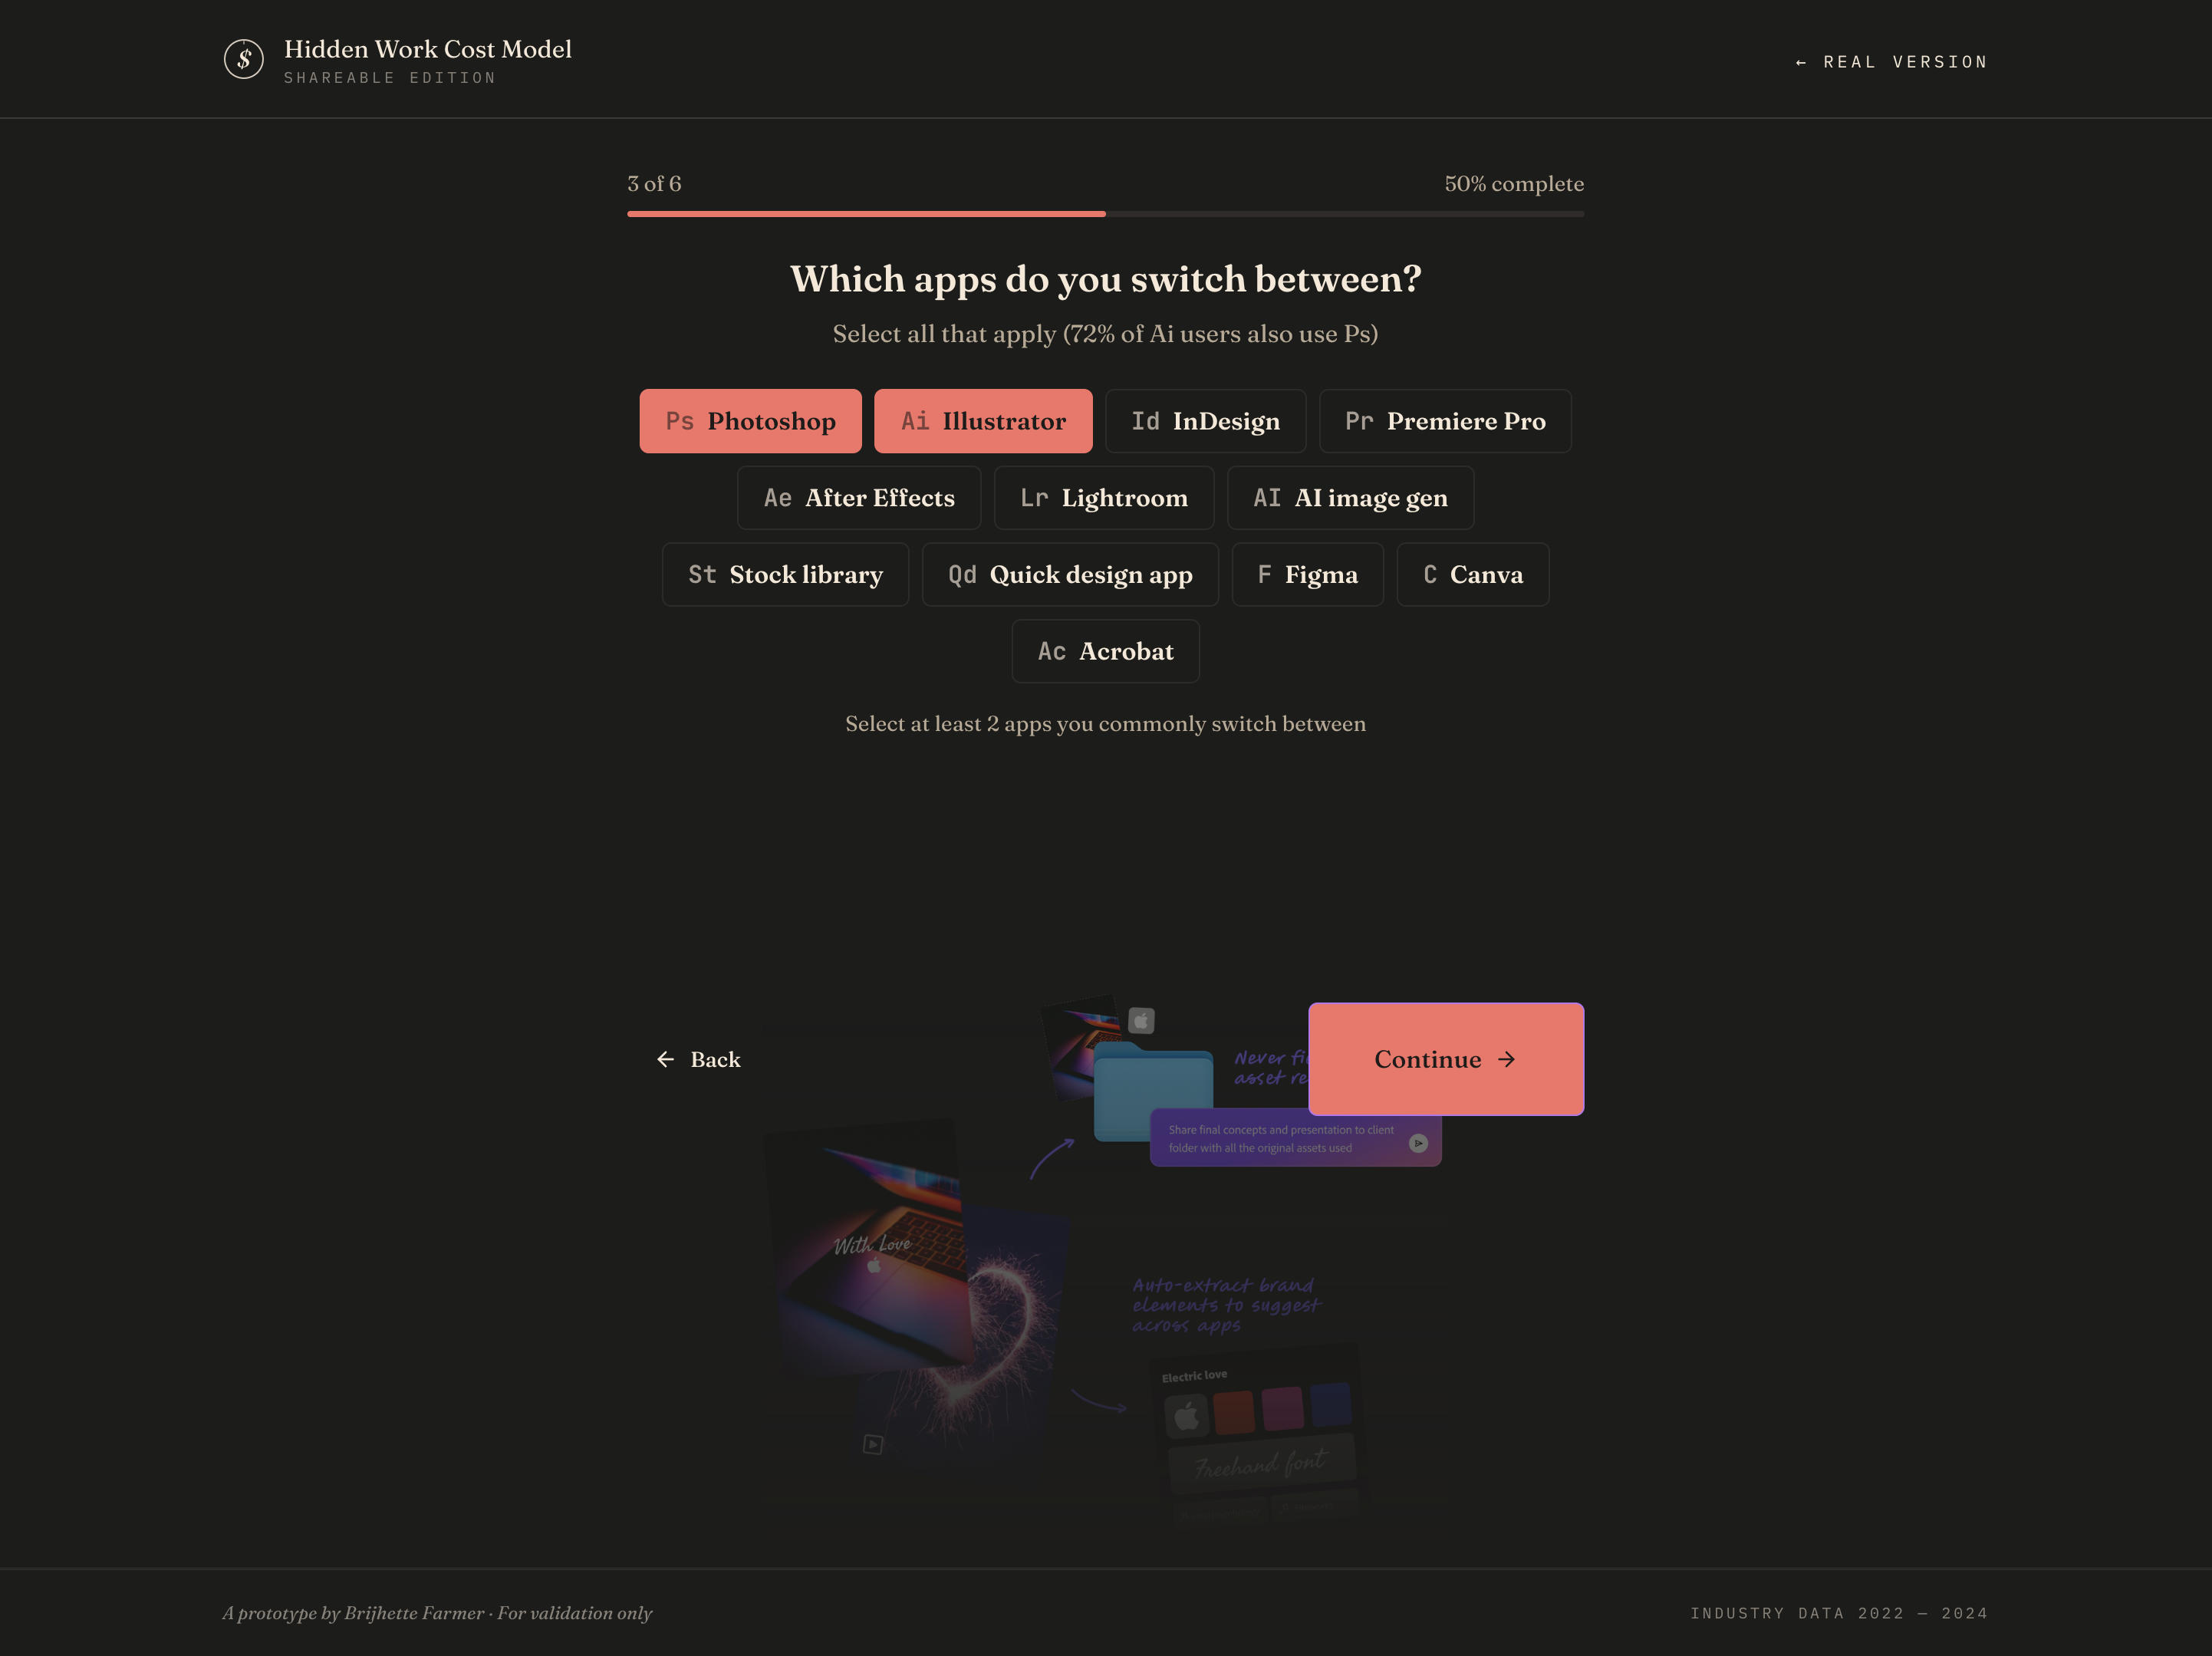
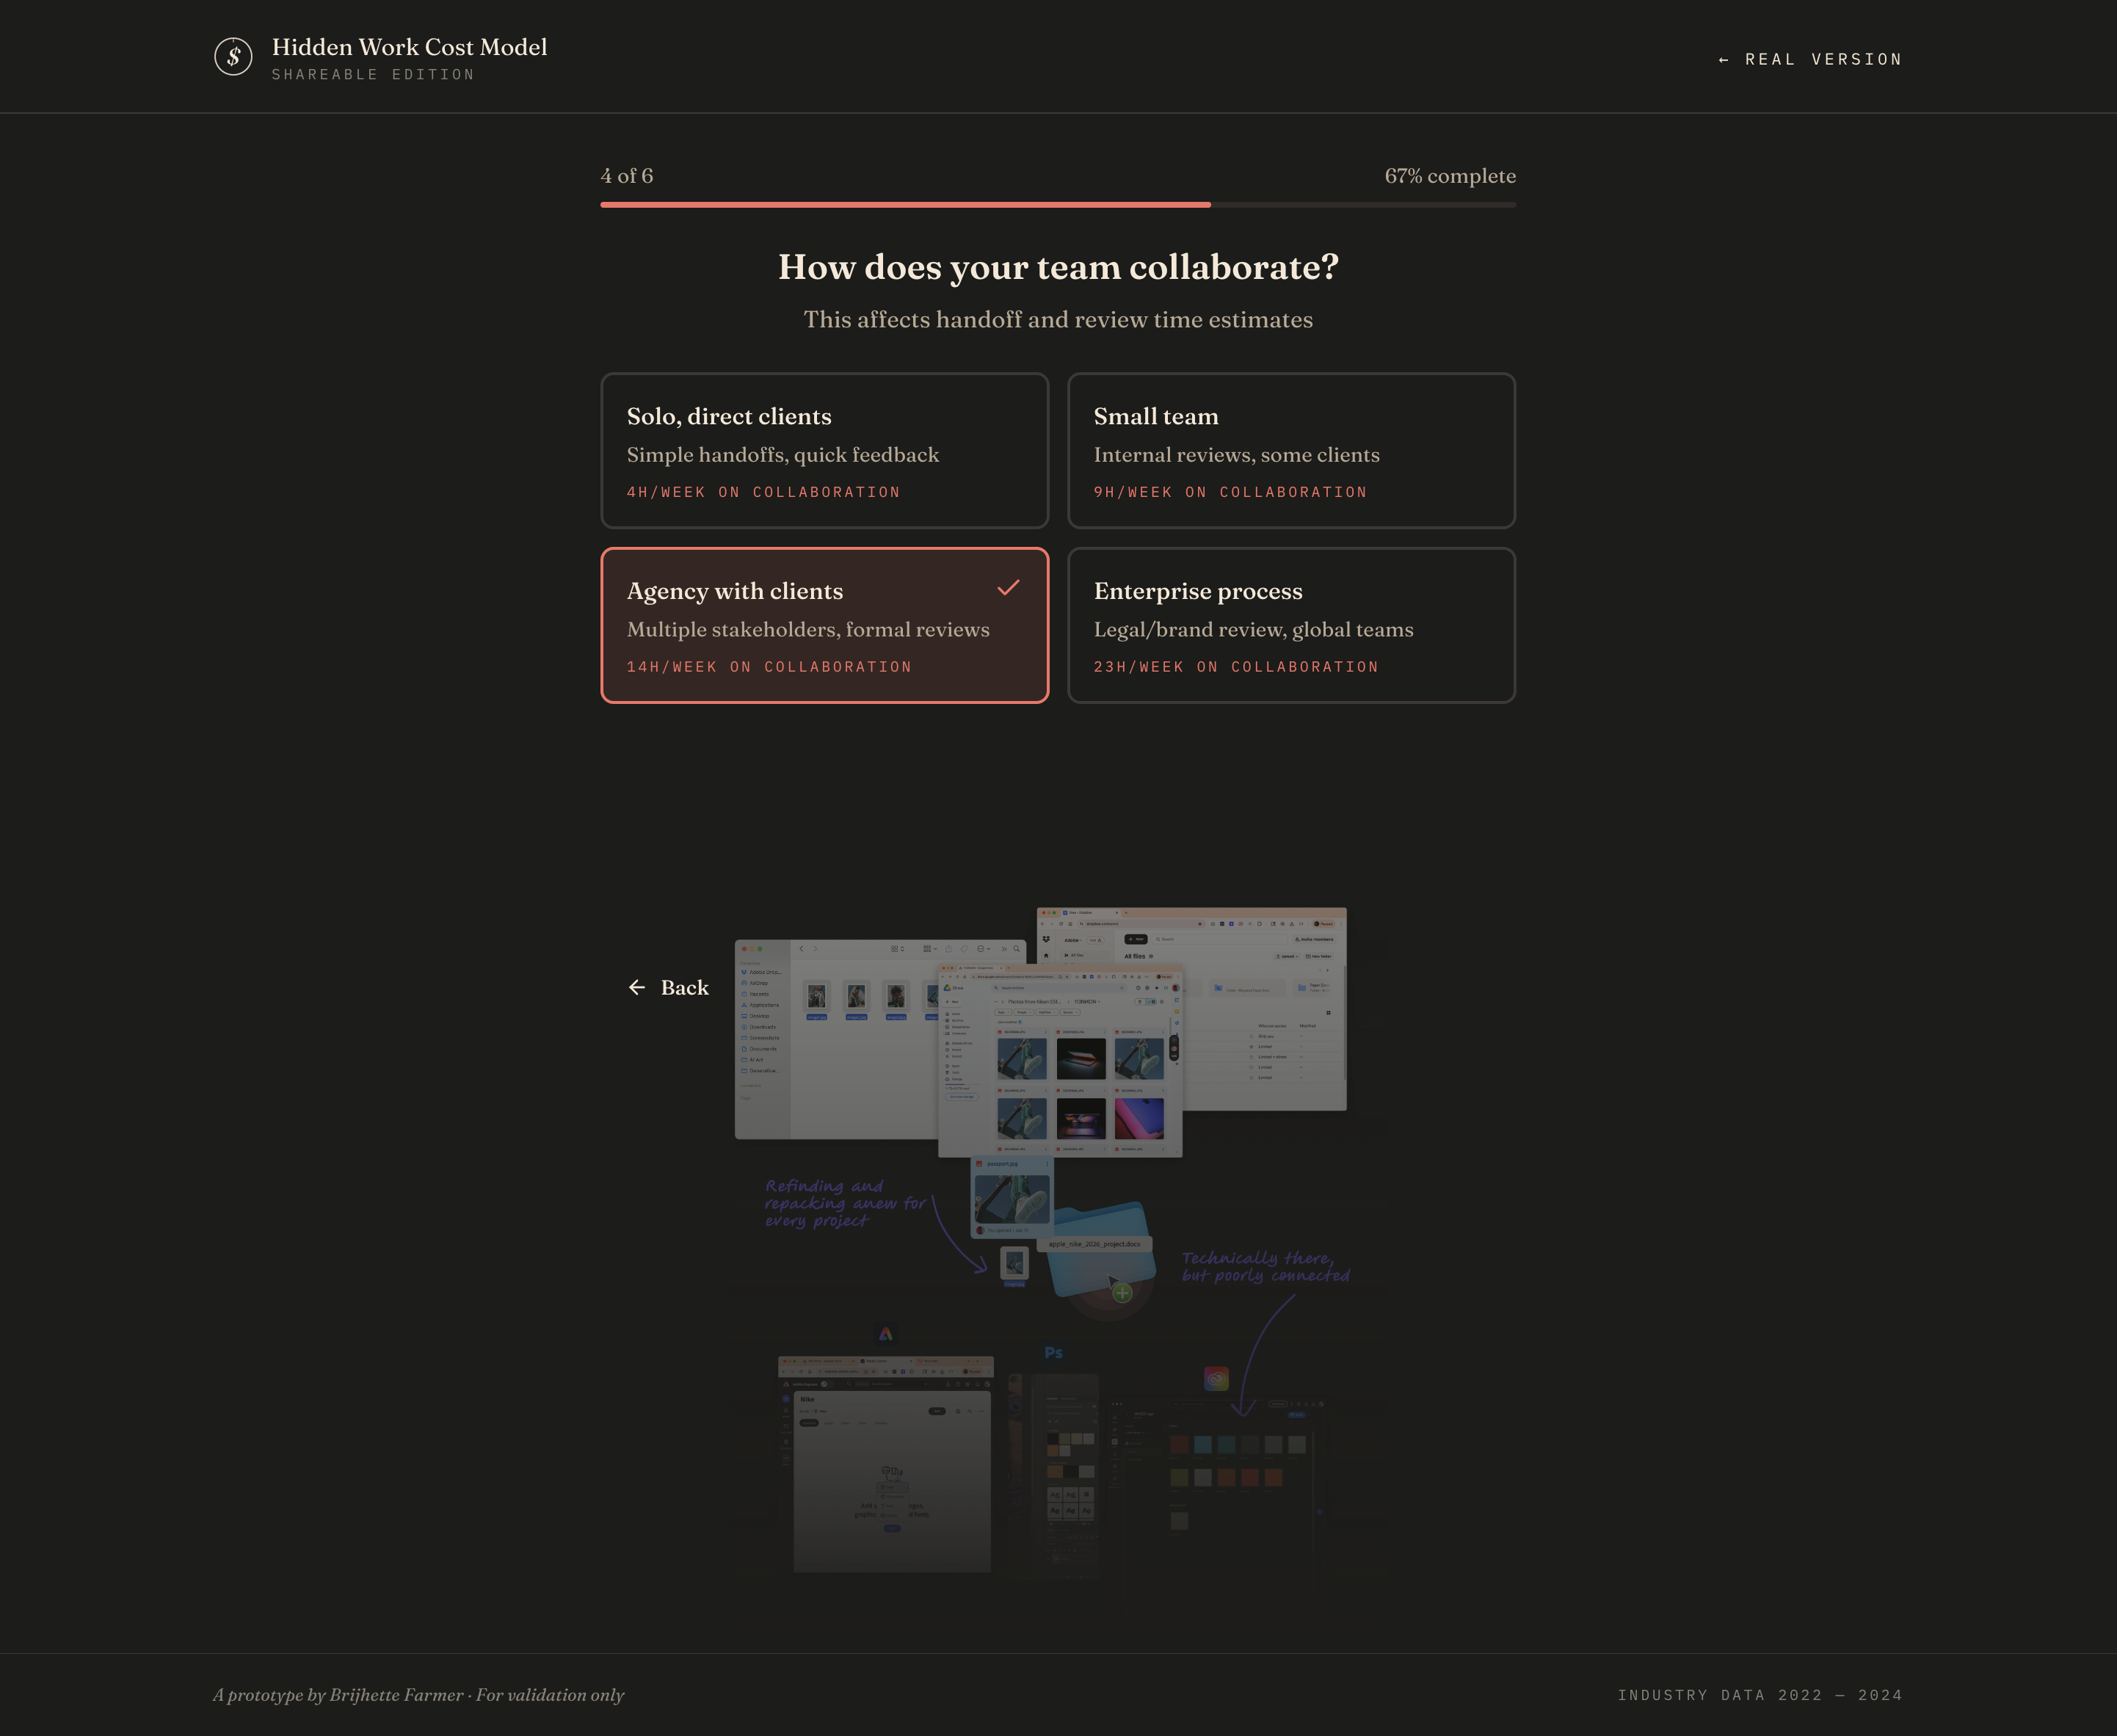
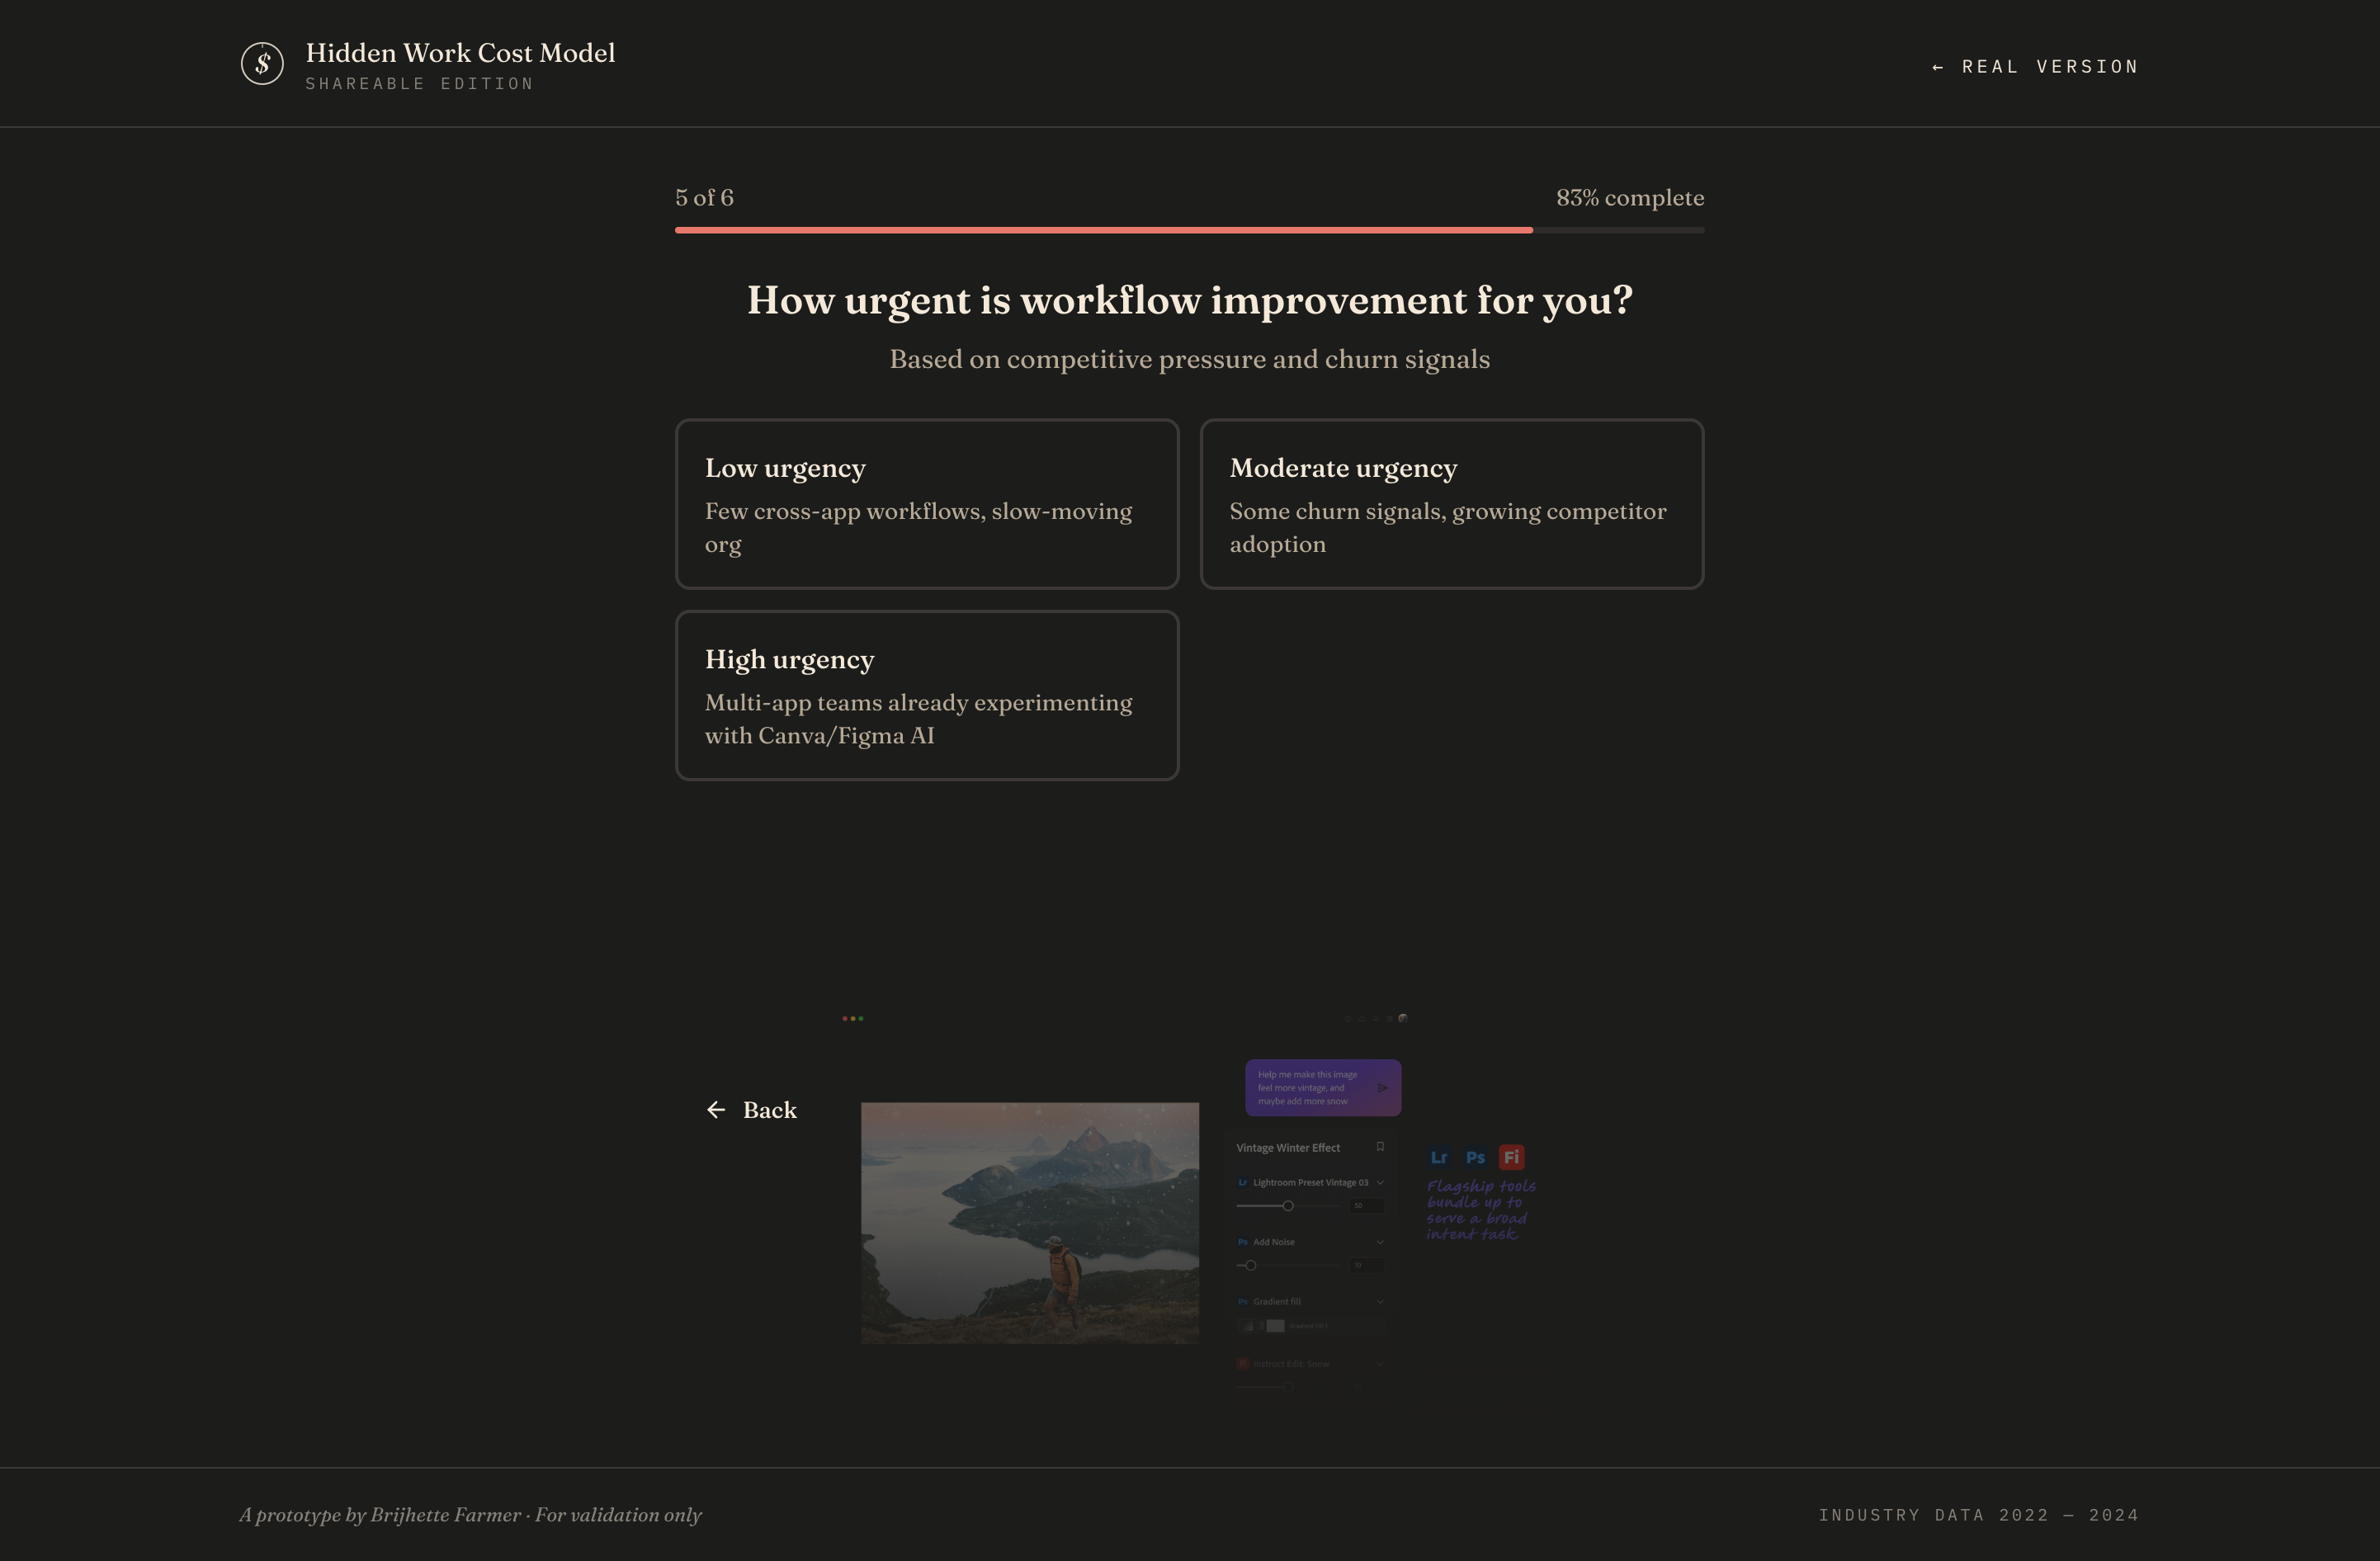
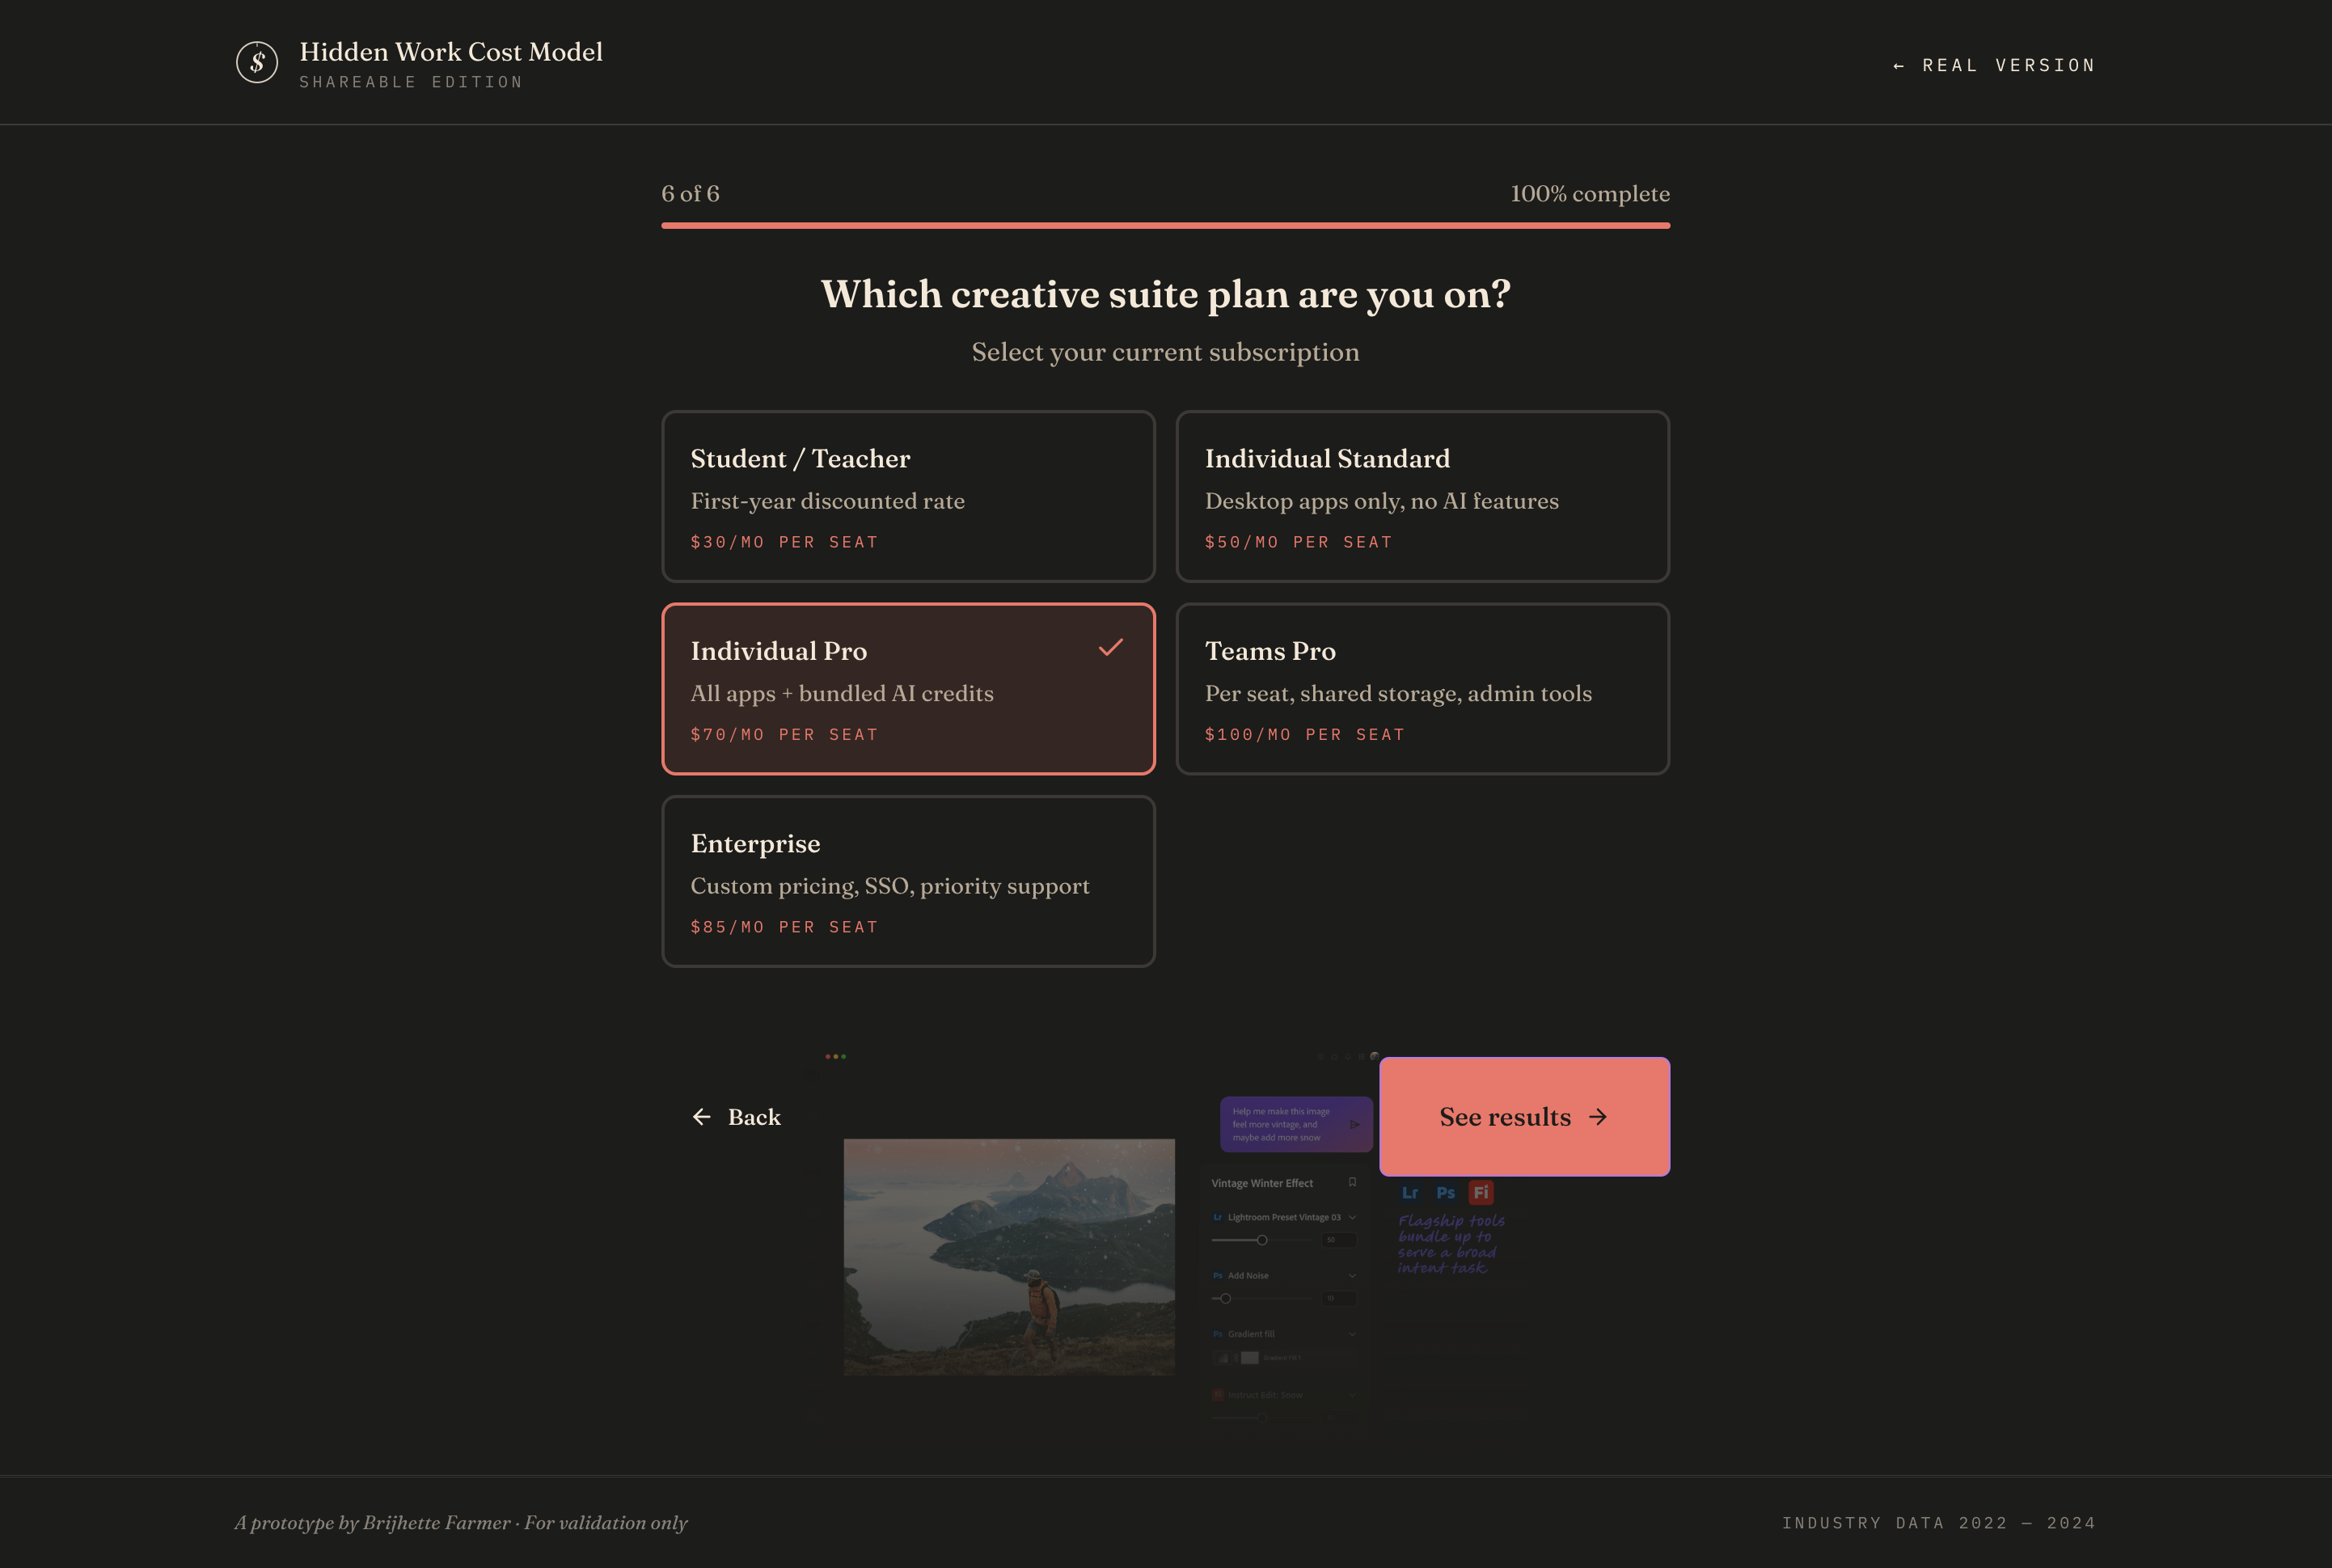
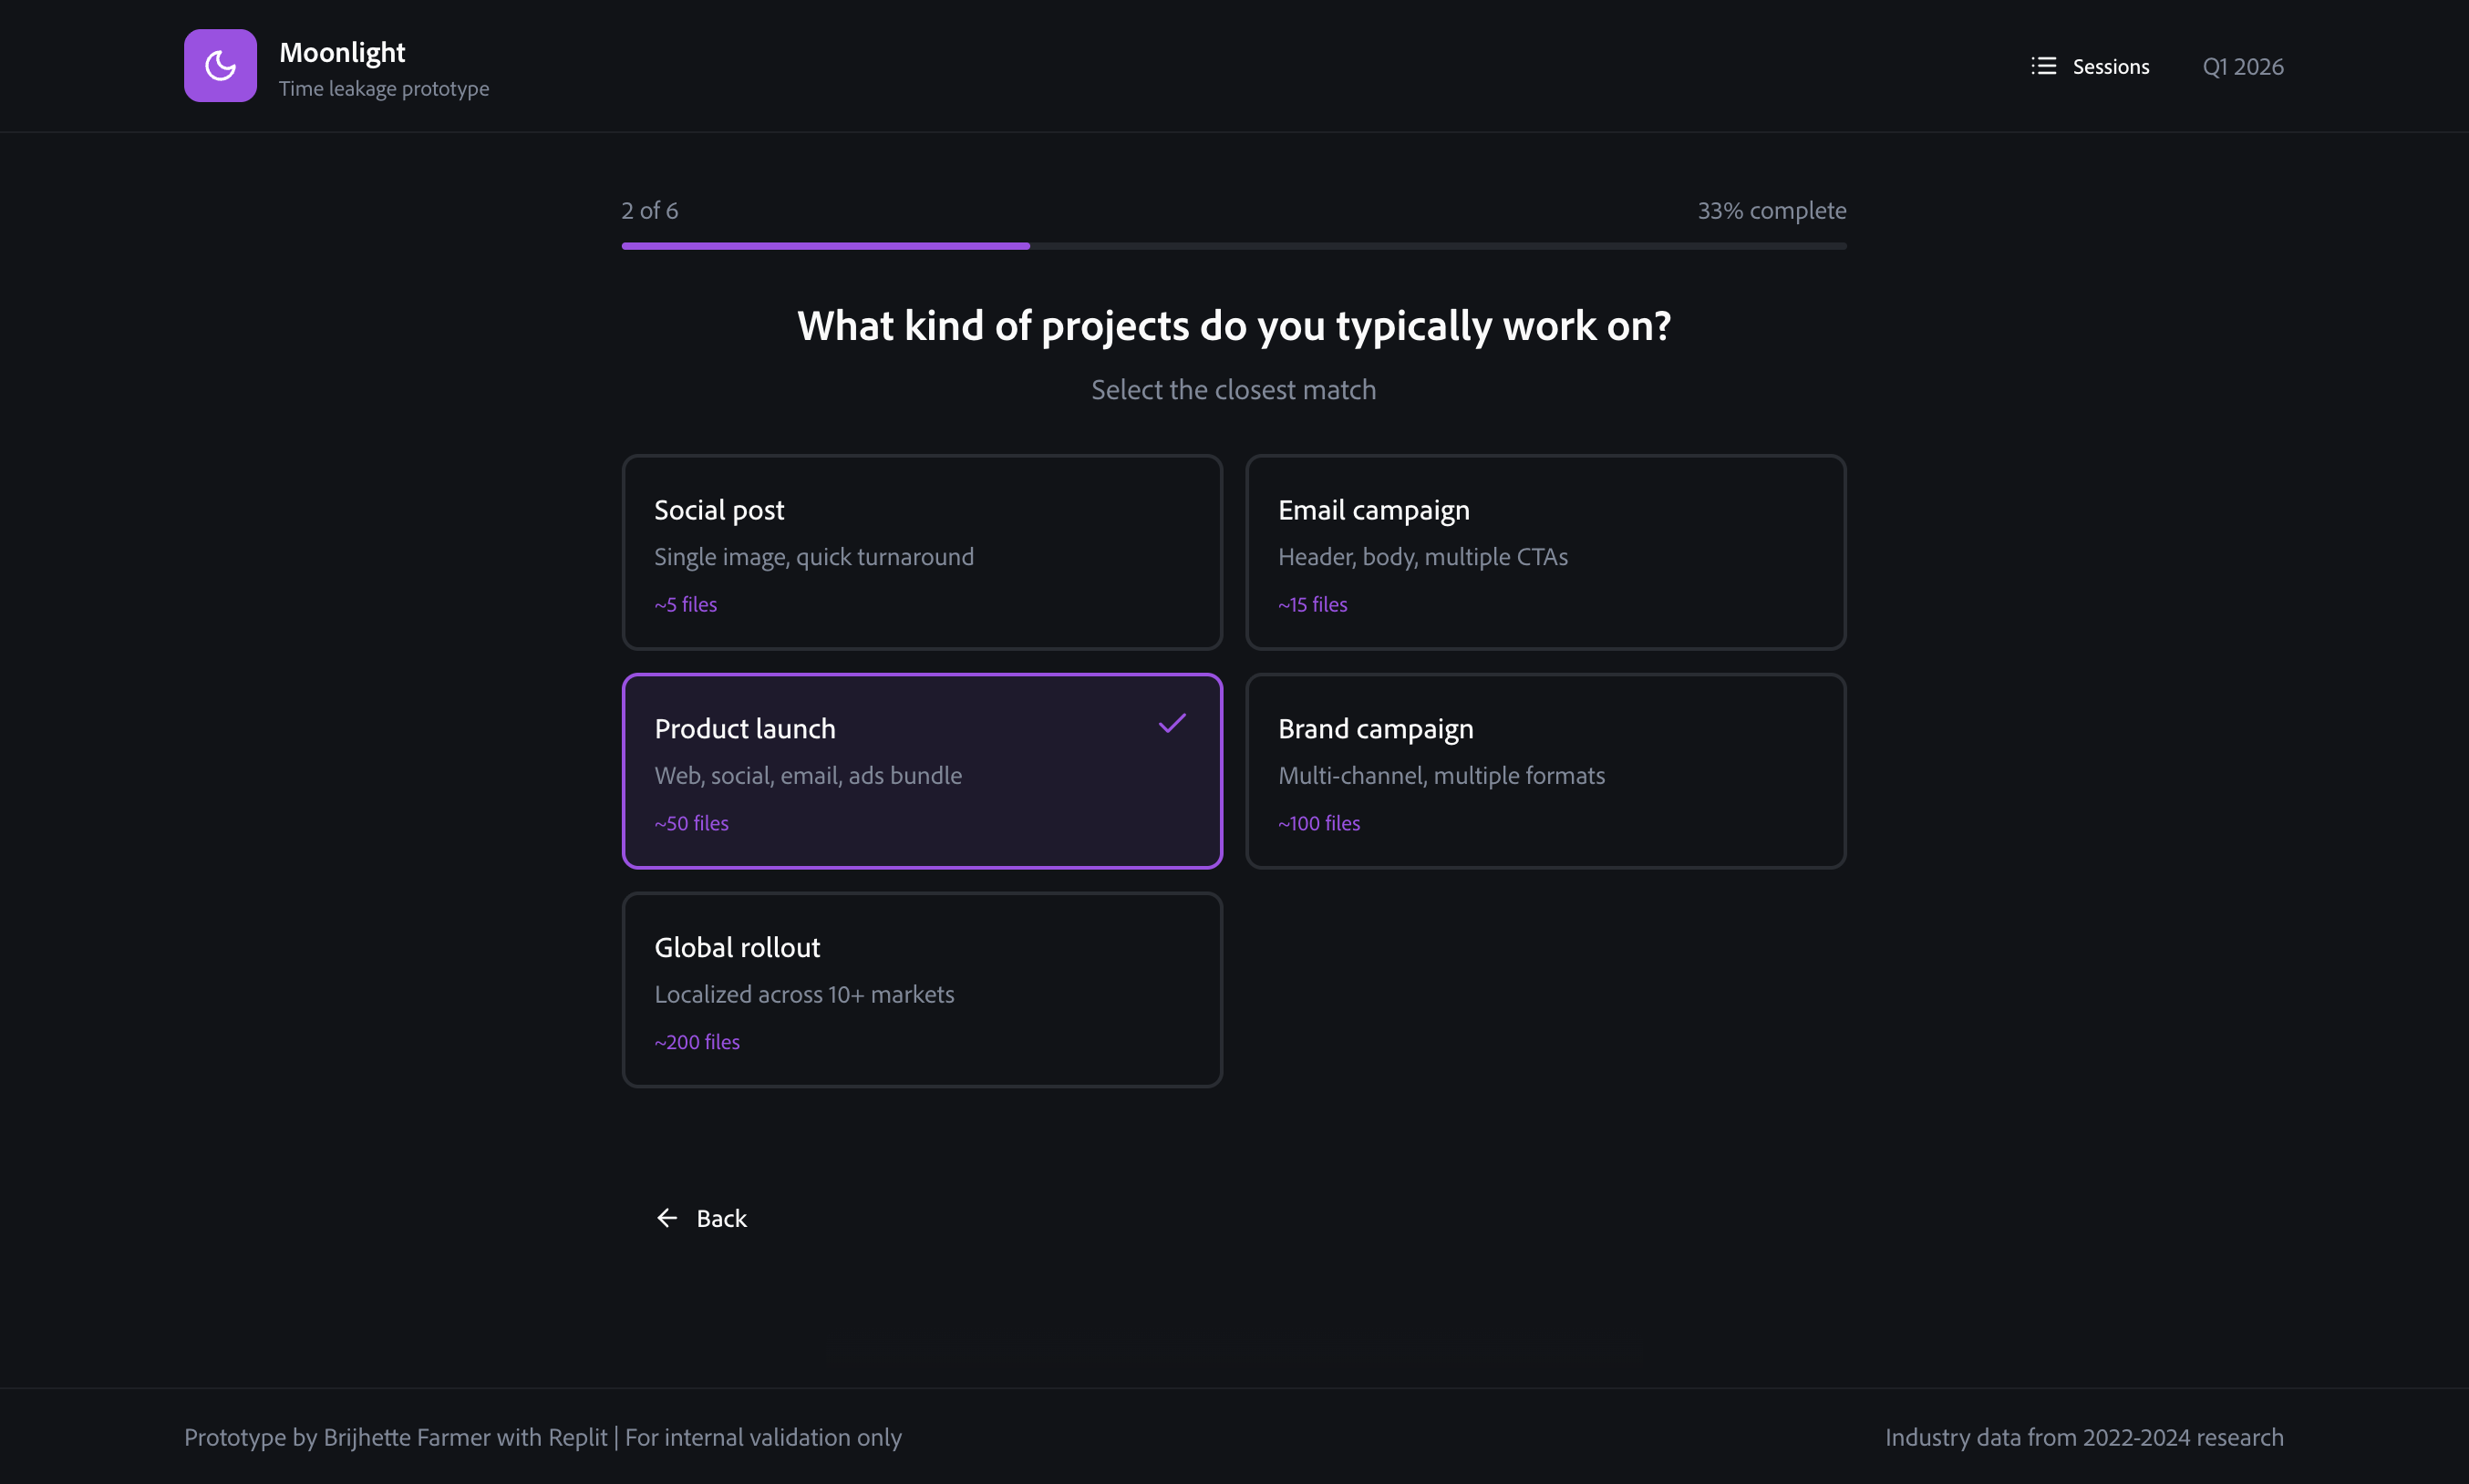
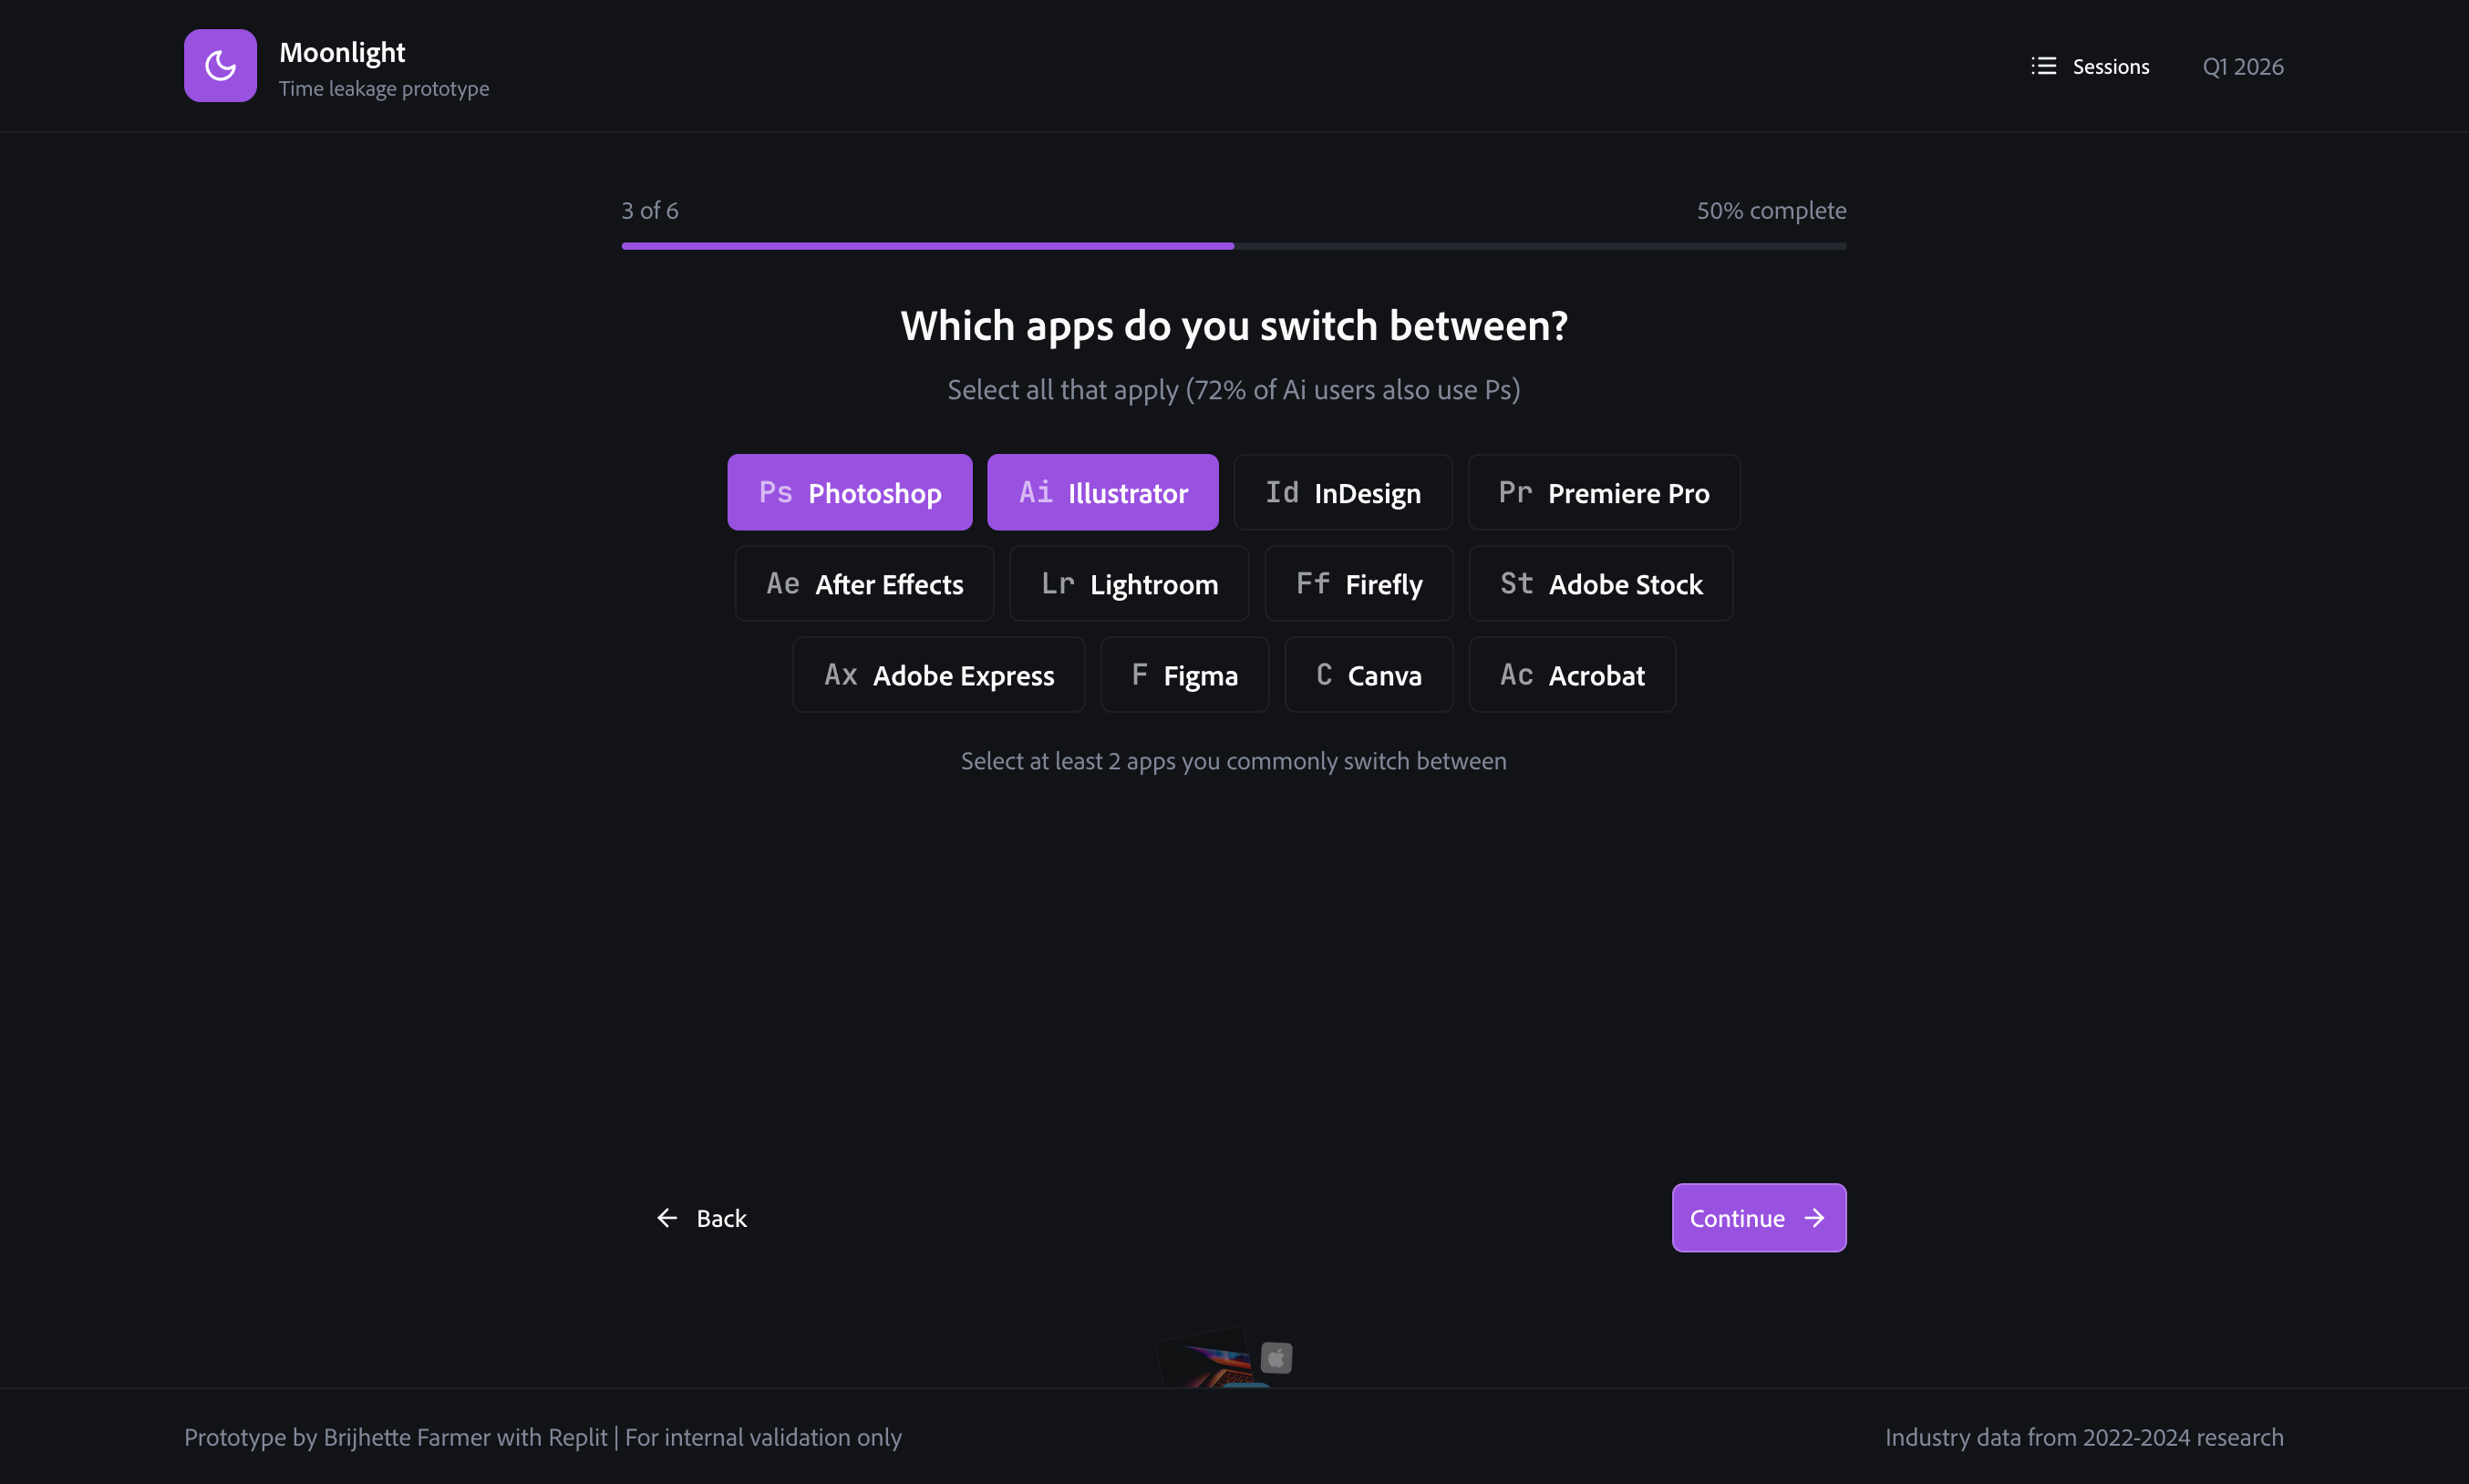
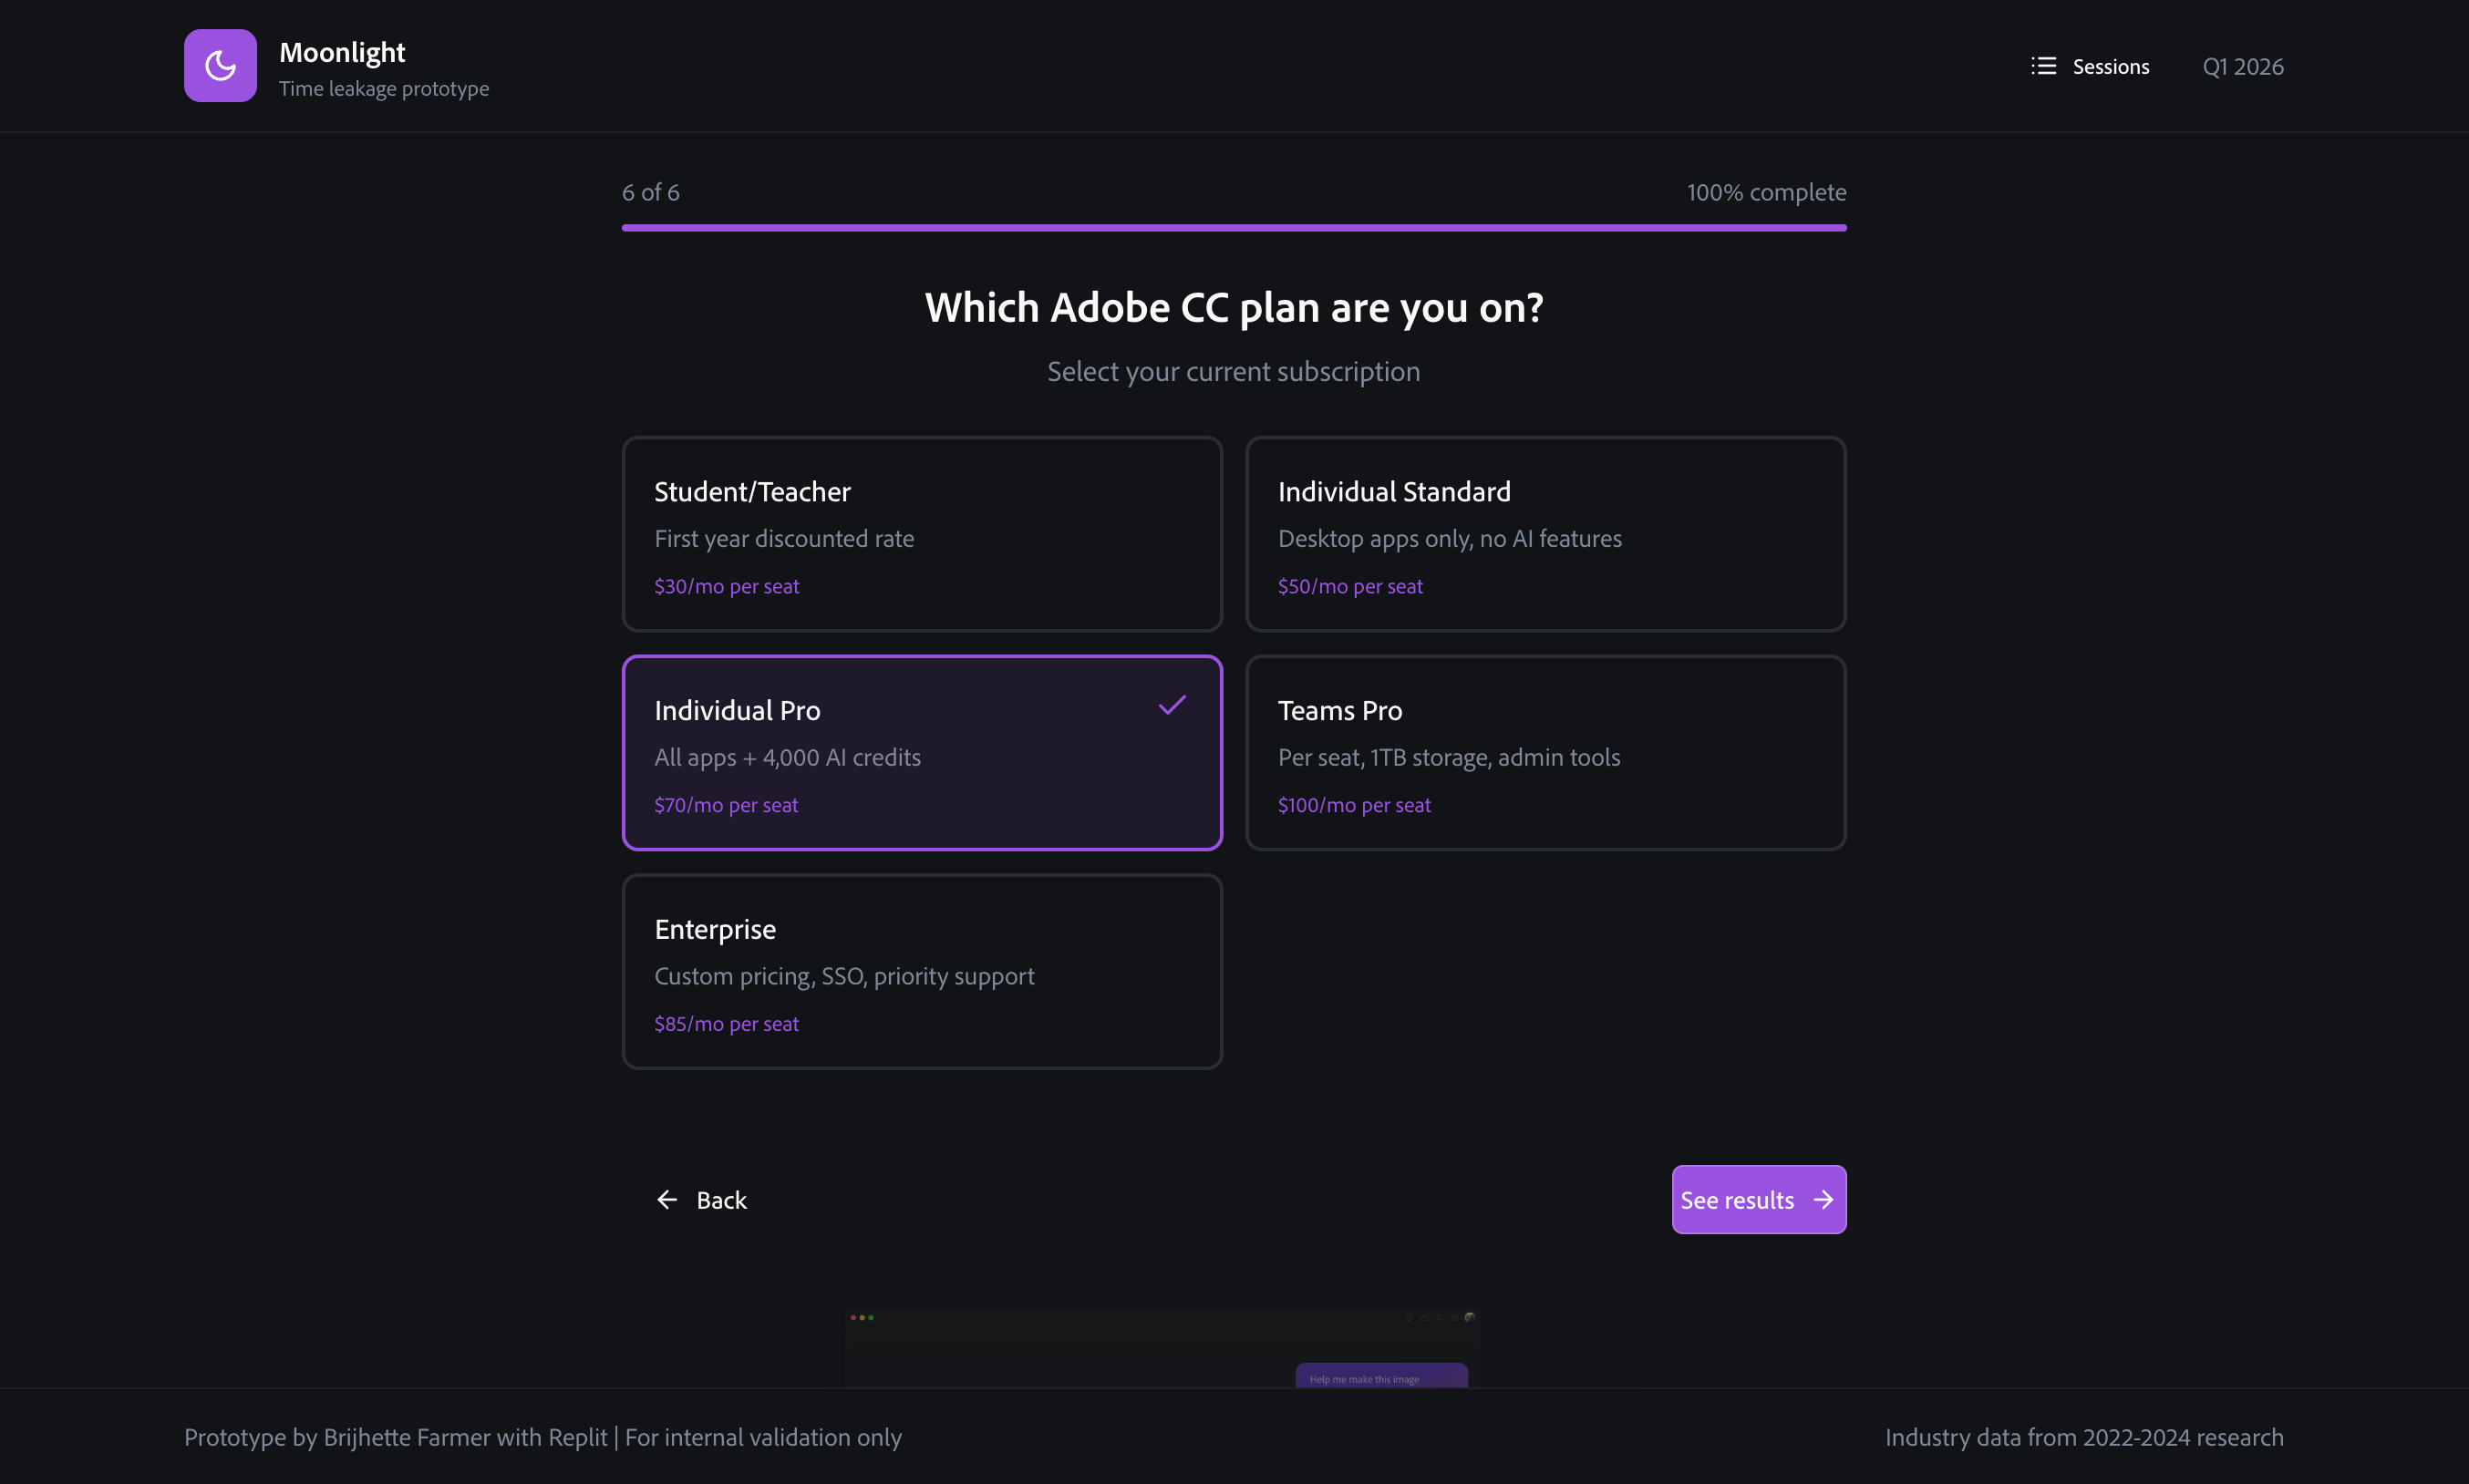
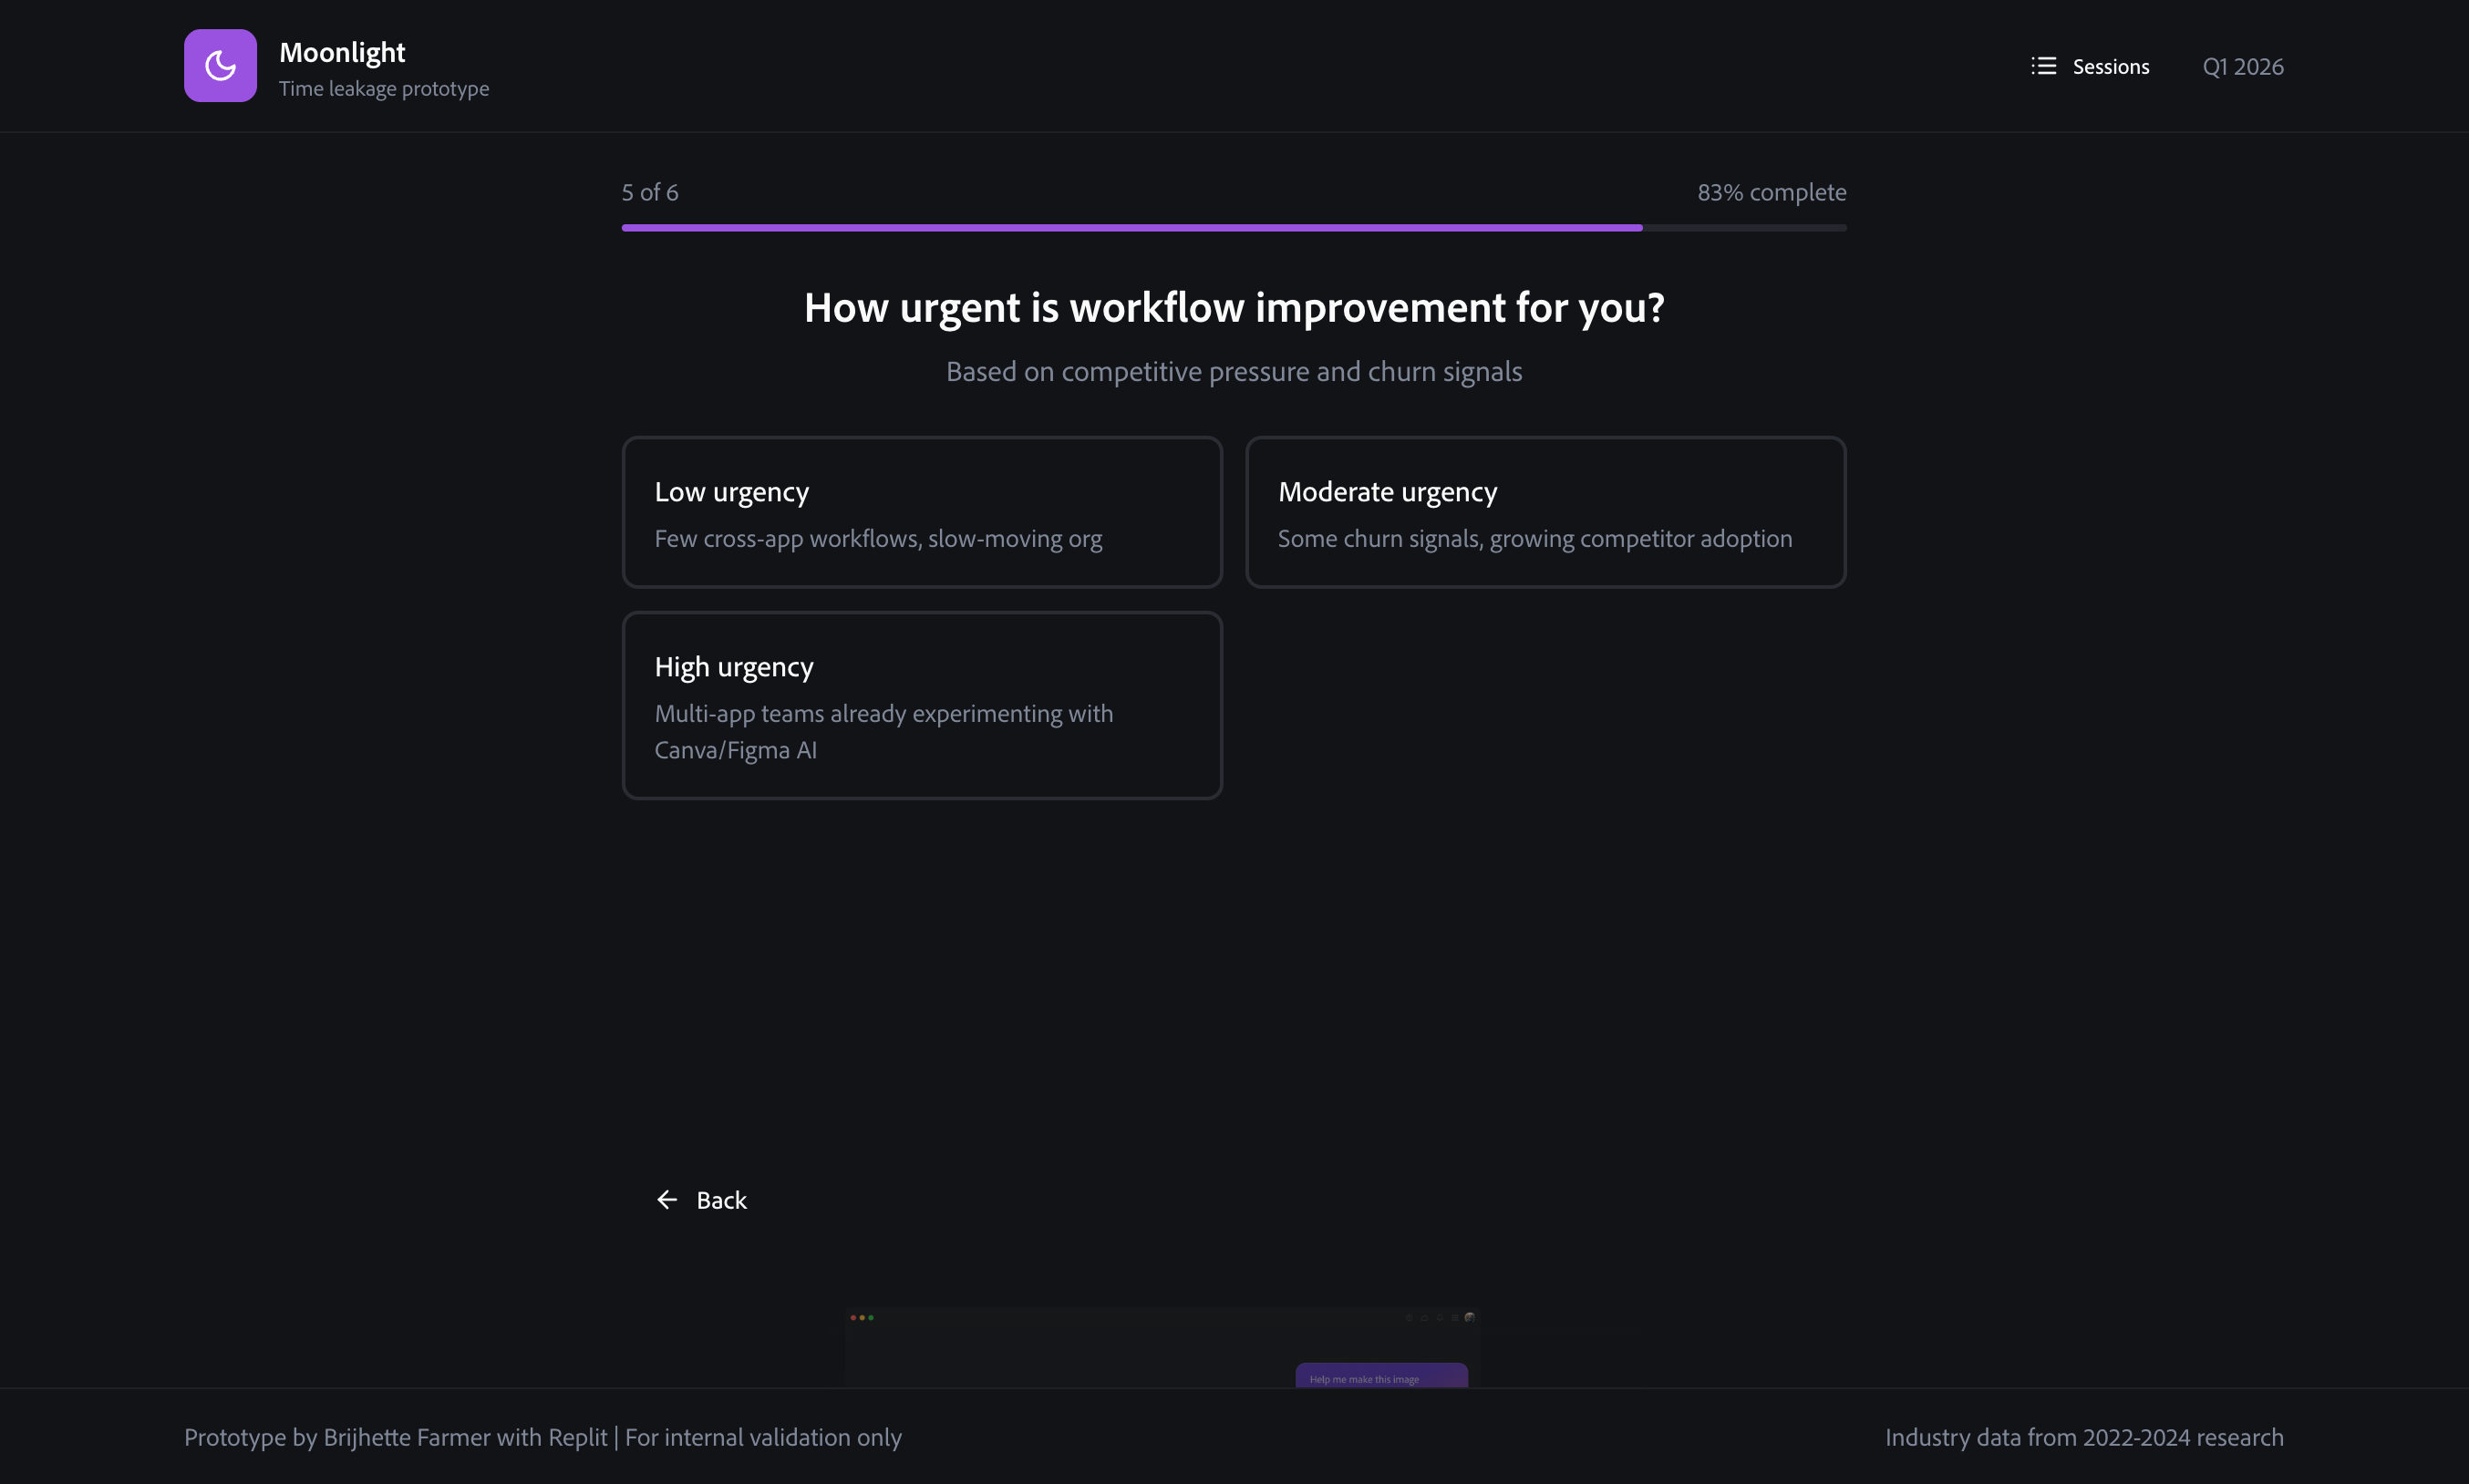
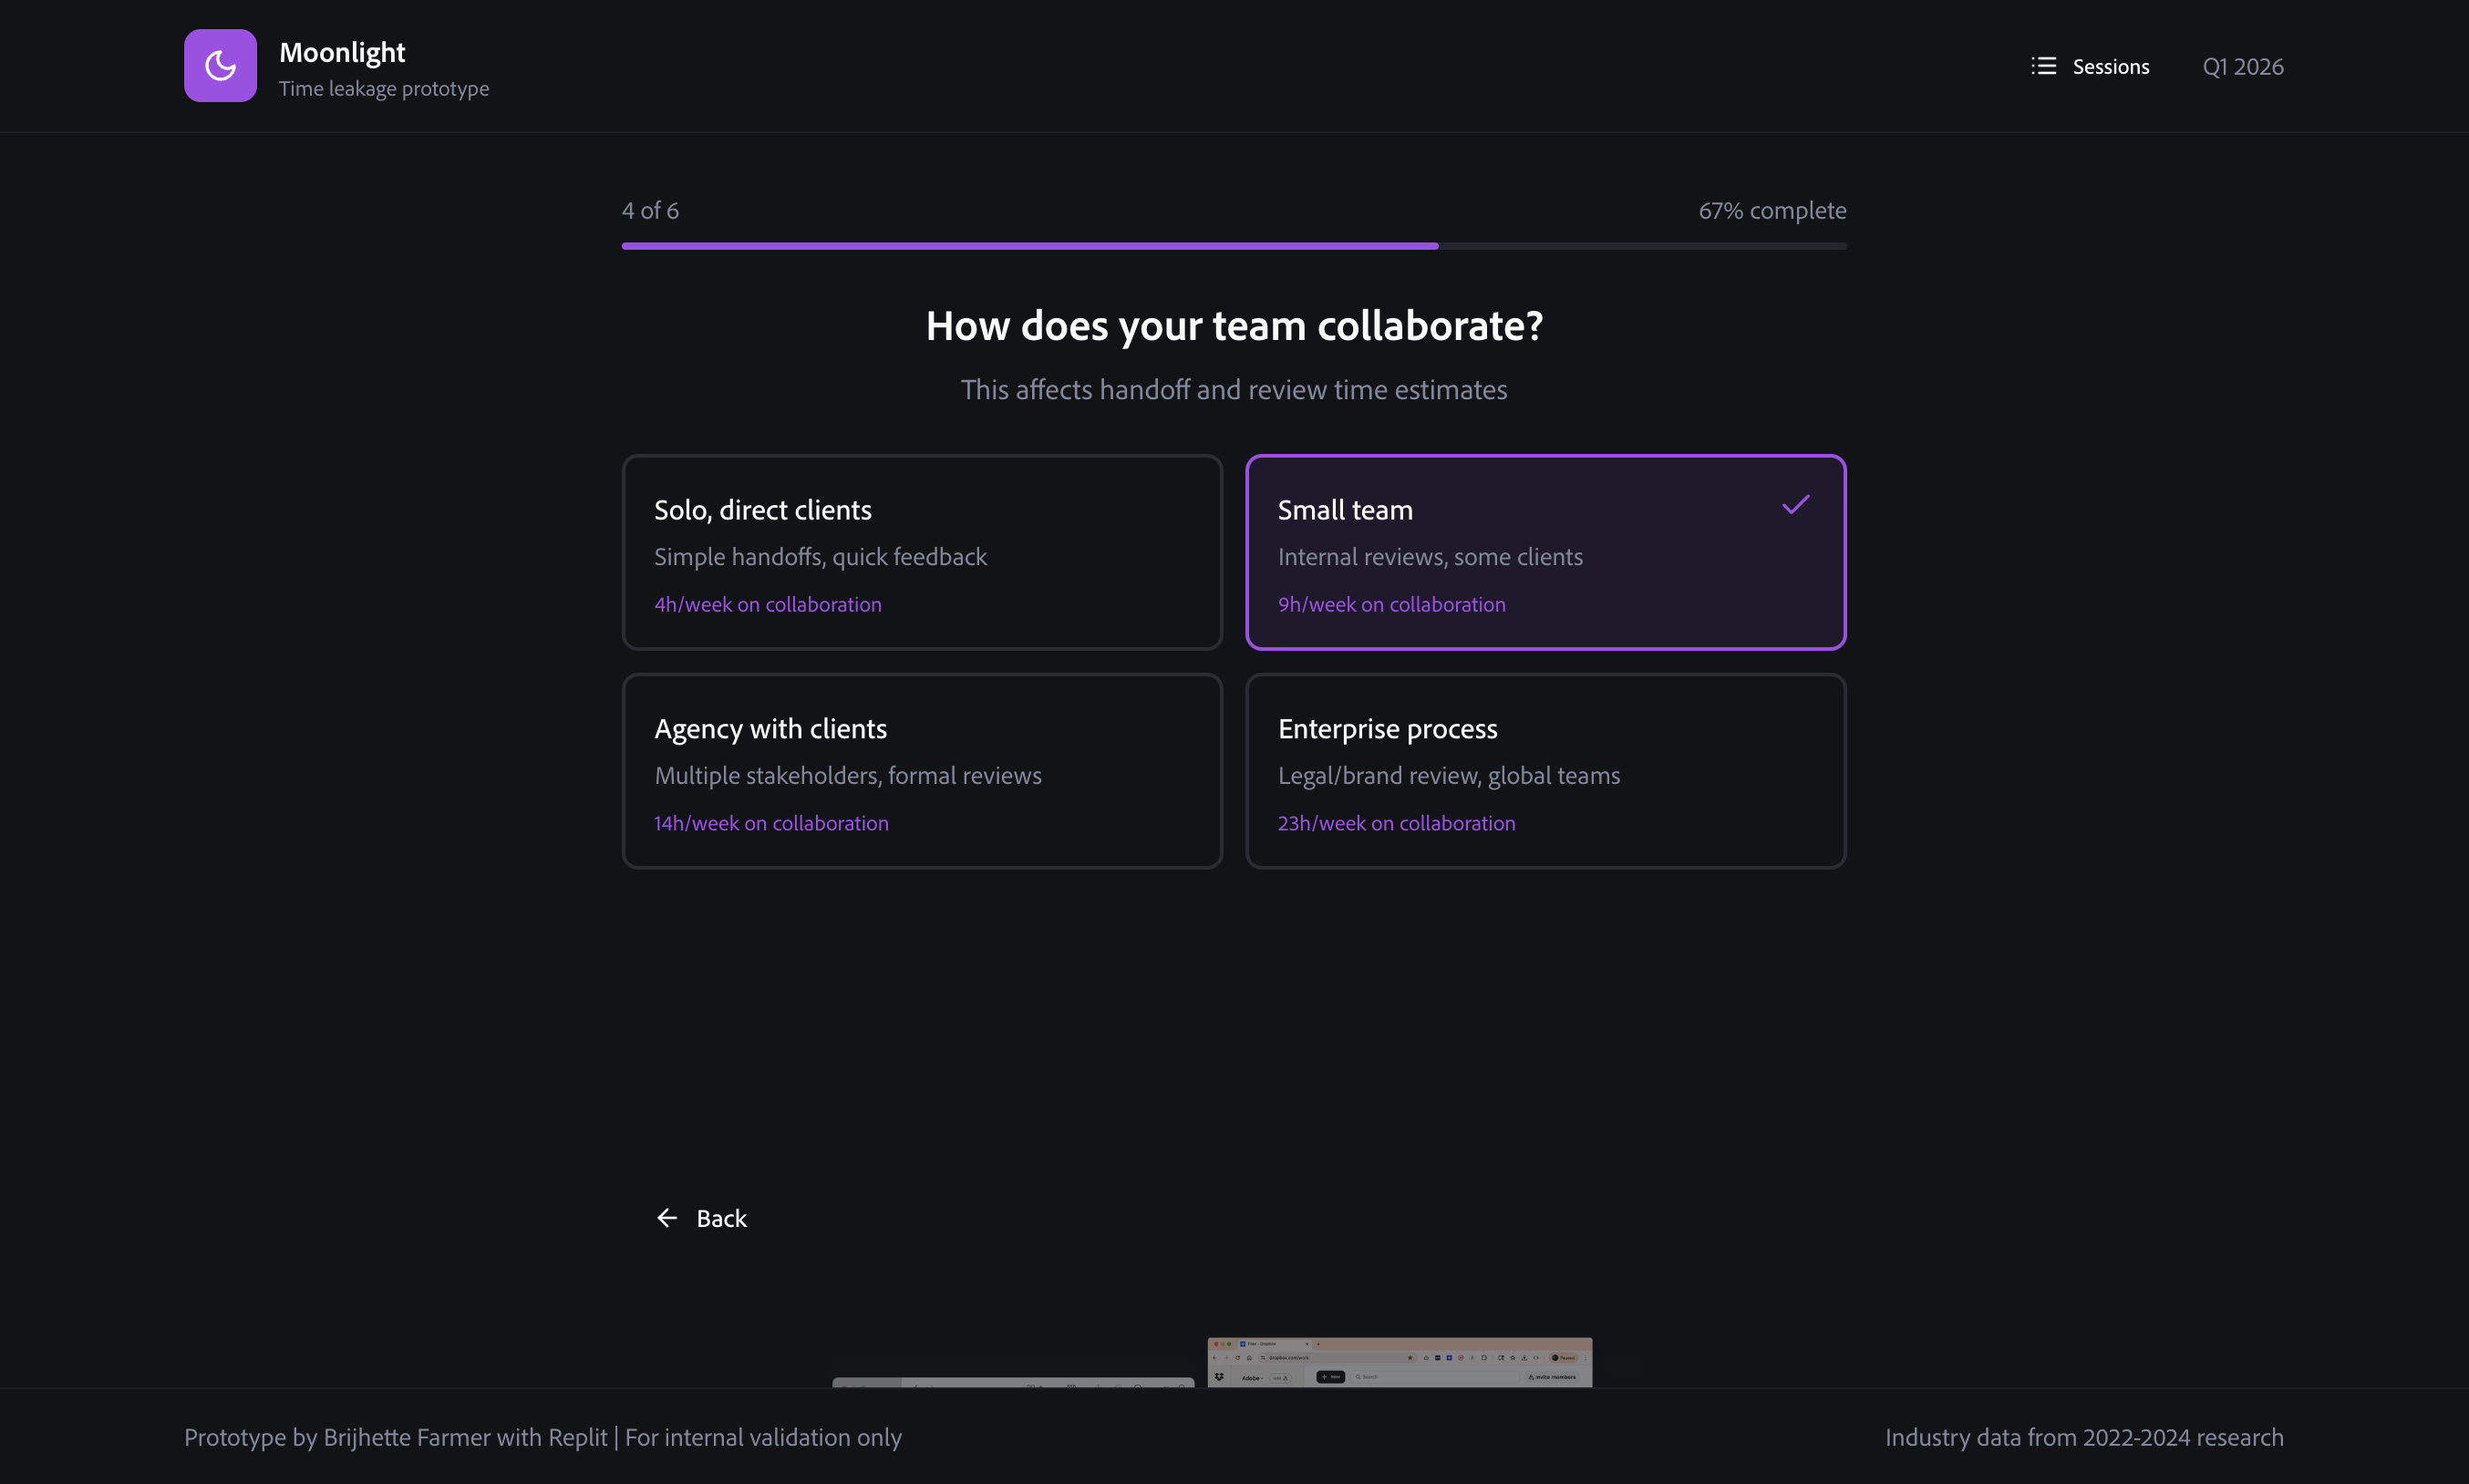
A Typeform-style six-question interview, complete with auto-advancing questions, contextual research imagery, and preset persona mapping, feeds a model across five research-backed friction categories: bulk action overhead, asset discovery, cross-app switching, coordination, and versioning. Each category calculates current weekly hours lost and projected hours saved with an agentic solution. A deliberate modeling choice: coordination friction uses half the efficiency gain of other categories, because collaboration involves human judgment that AI can only partially automate. The model doesn't pretend otherwise.
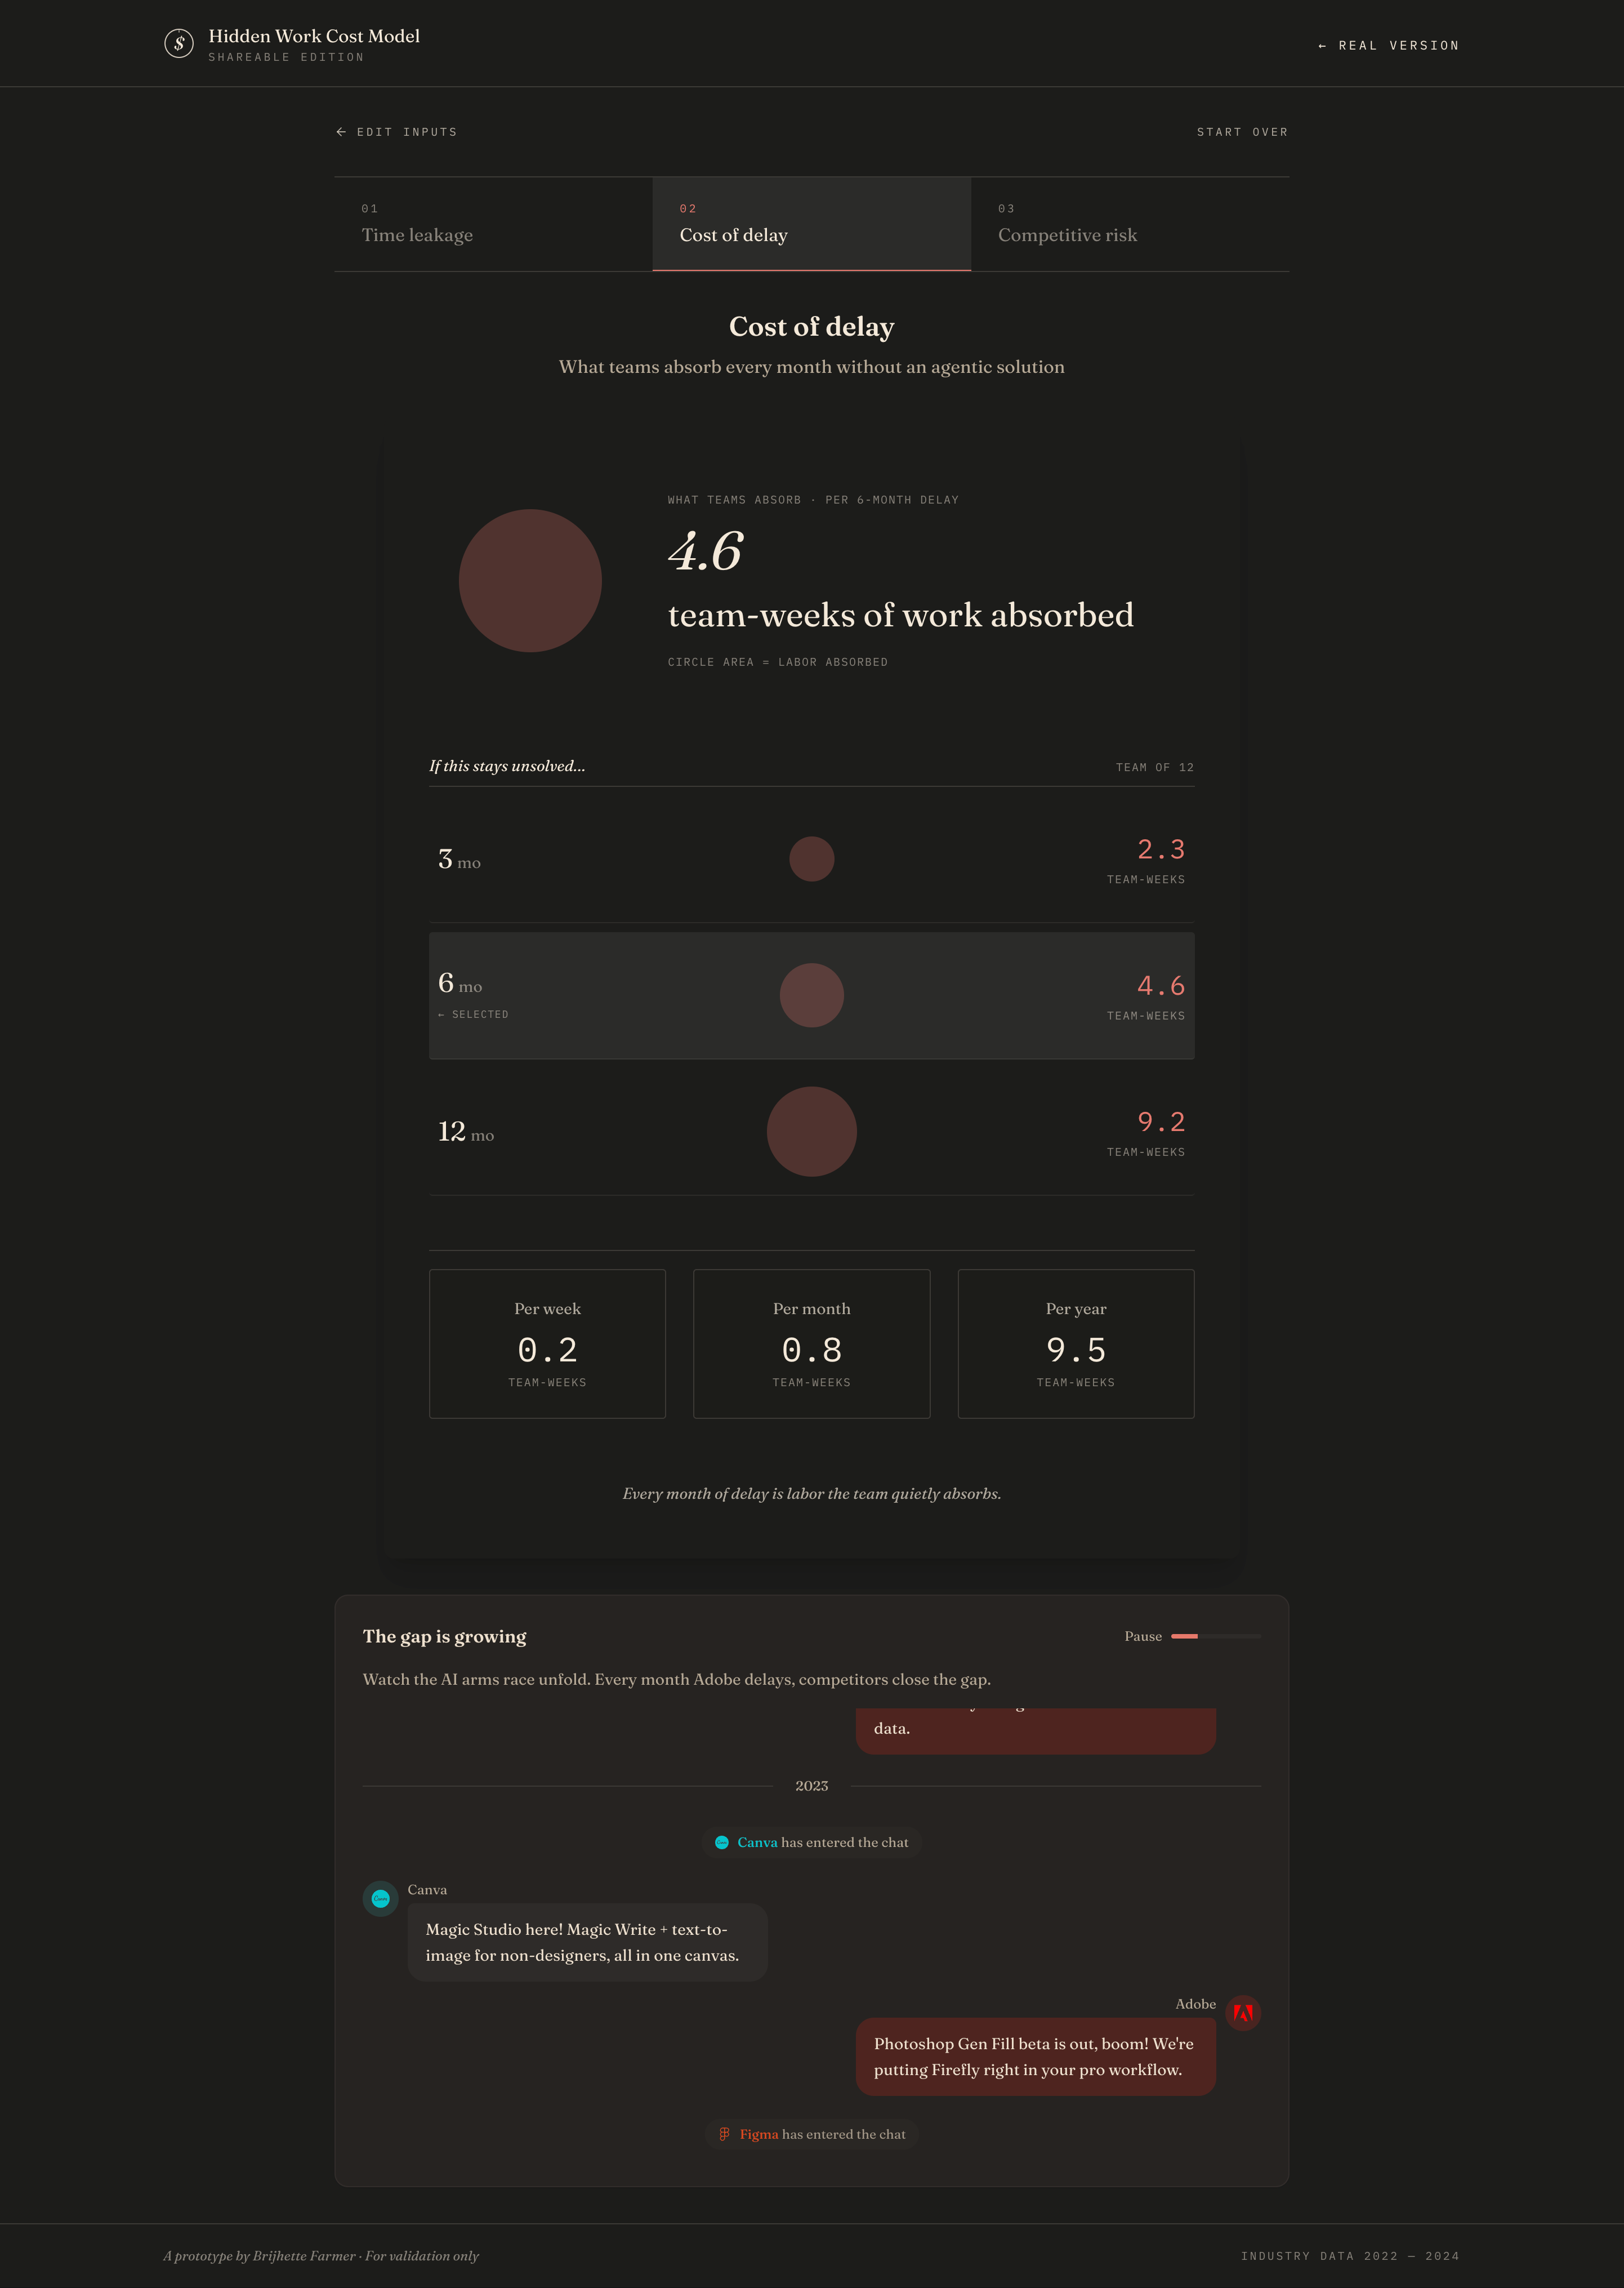
Cost of delay.
A financial projection tab converts time savings into dollar figures across 3, 6, and 12-month delay horizons. These were framed as "customer-absorbed overhead" rather than "wasted time." This language was deliberate: it positions the cost as something Adobe's customers are currently paying, which makes it Adobe's problem to solve. Alongside this, a chat-style competitive timeline, compiled from deep Perplexity research into public AI product launches, visualizes the 2022–2025 AI landscape as a group chat, with companies "entering" and posting announcements in real time.
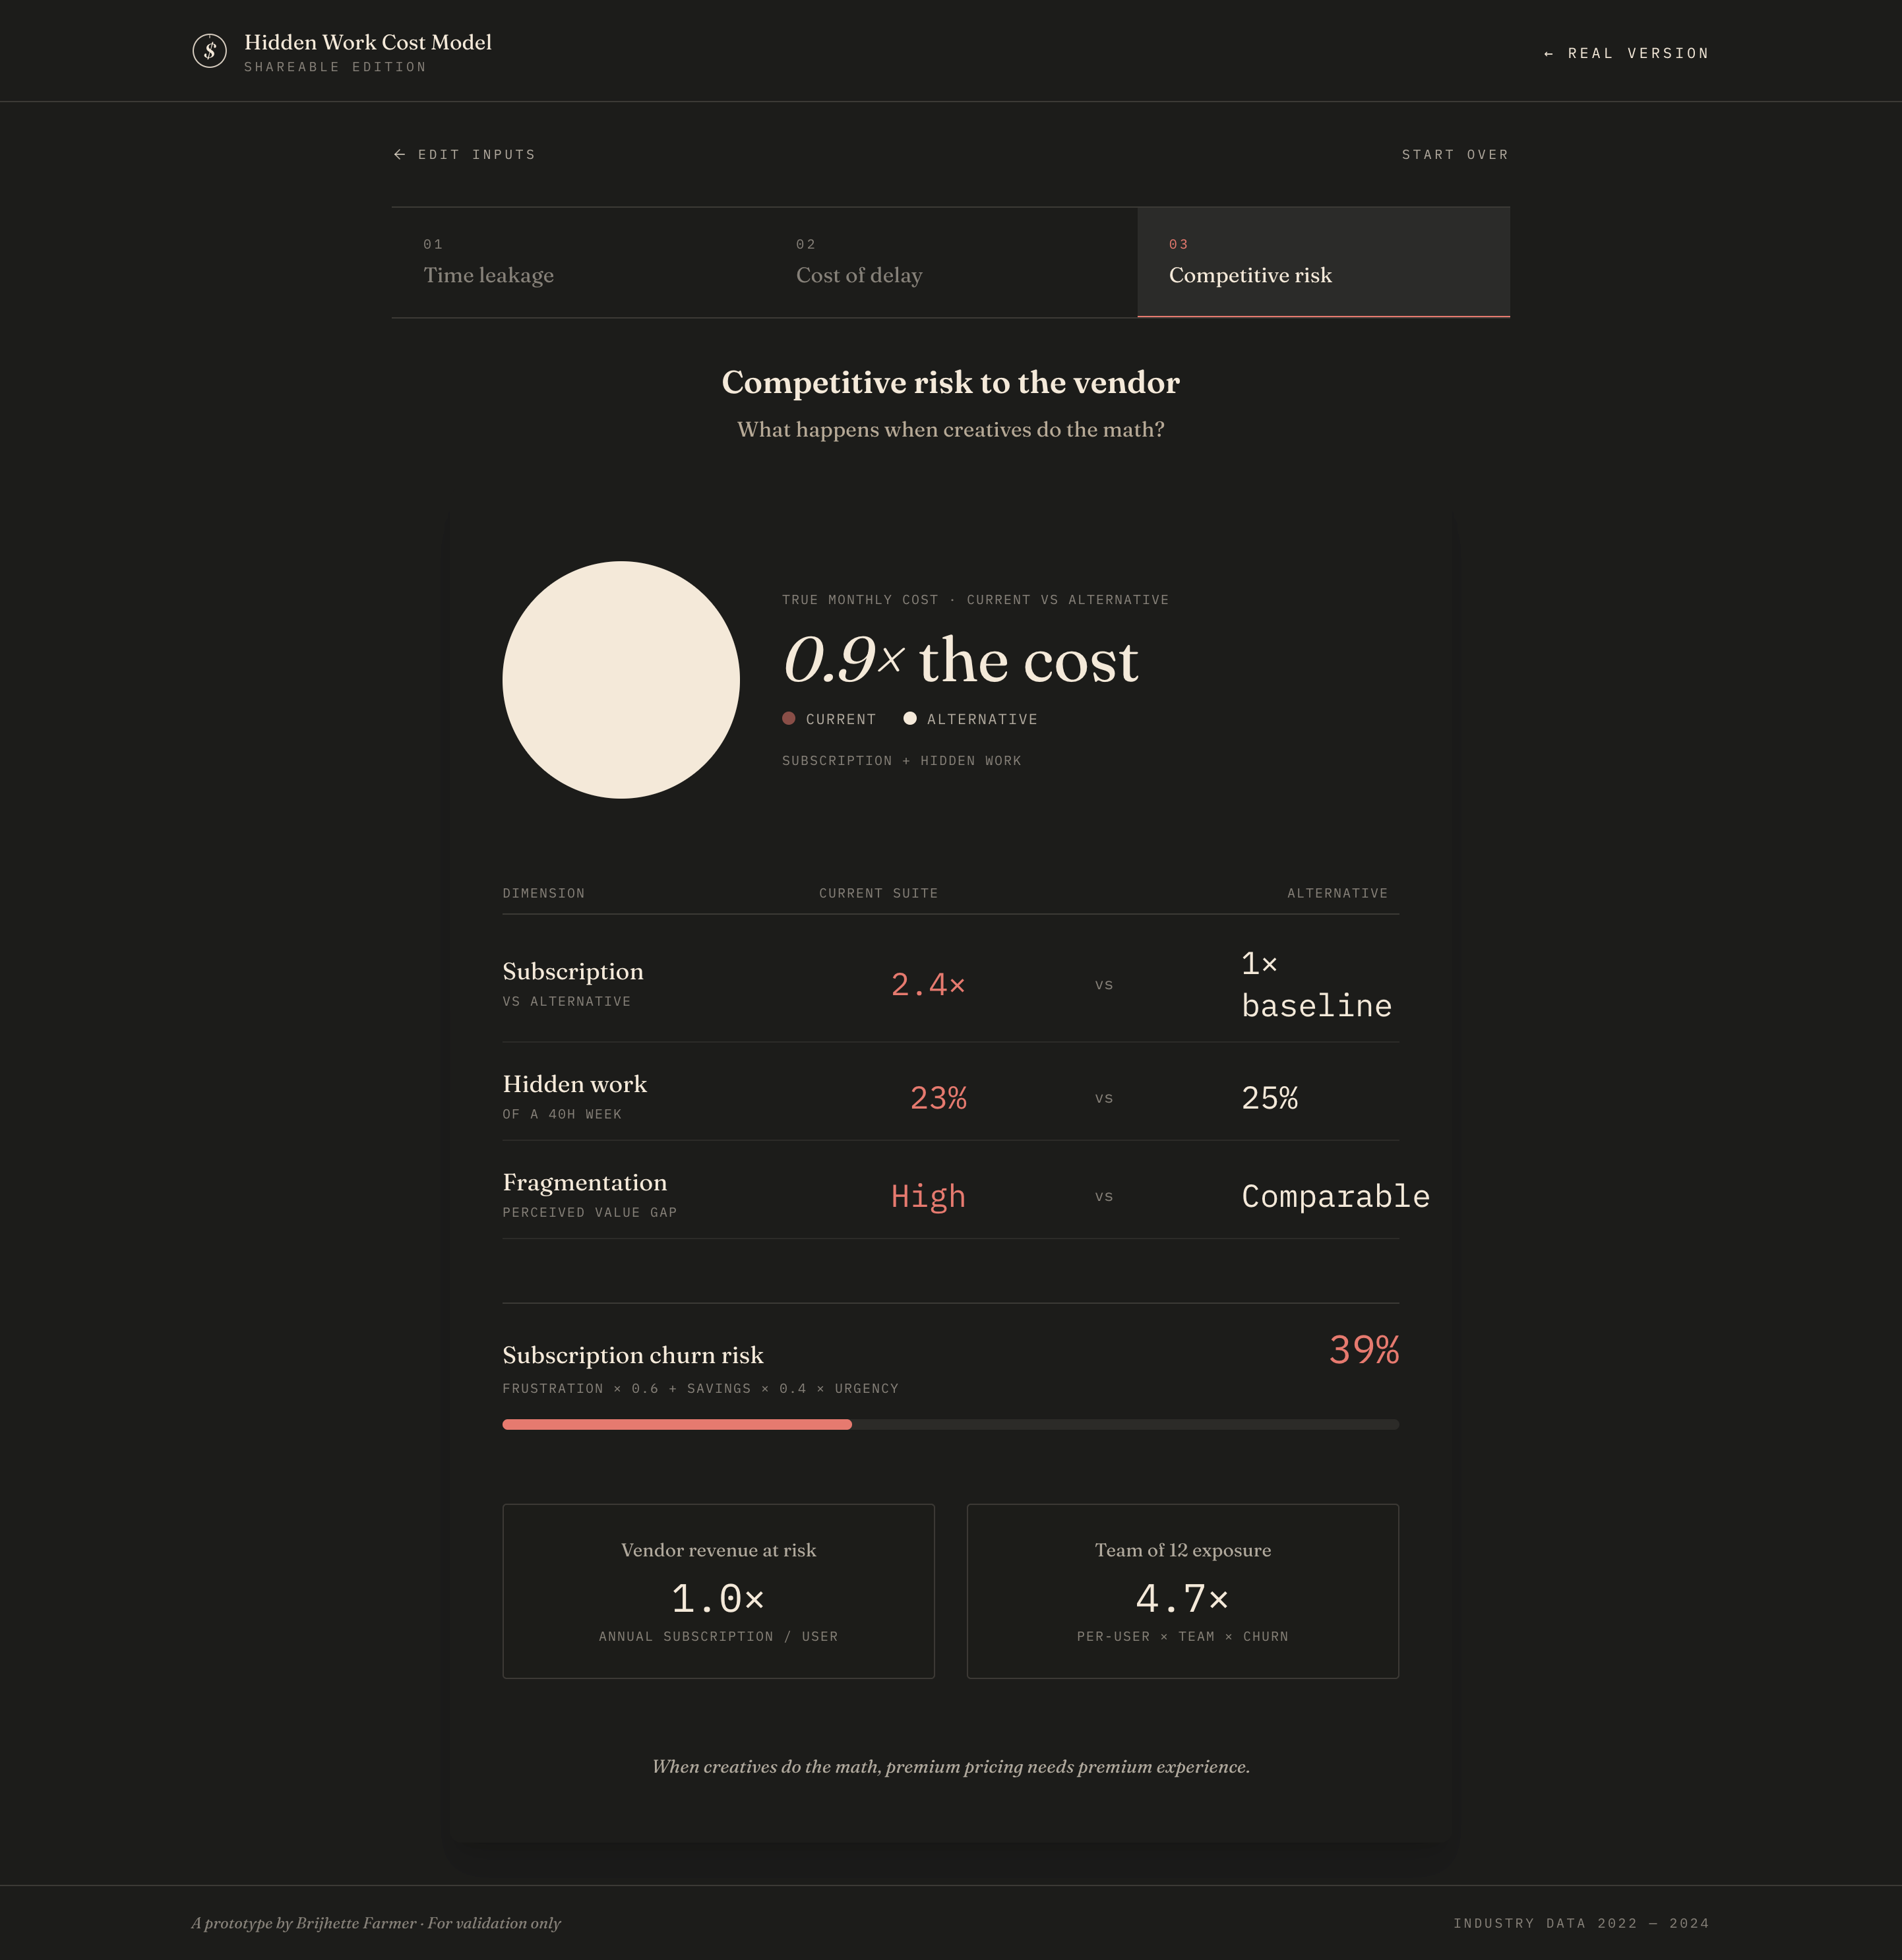
Competitive risk.
A churn risk model compares an ecosystem's softwares "true monthly cost" (subscription + hidden work labor) against alternative tool stacks. The insight: a $60–100/month subscription might carry $800–2000/month in hidden labor costs. If alternatives solve even some of that friction at lower subscription cost, the economics shift. The tab calculates a churn risk percentage and converts it to revenue at risk per user and per team, giving finance-oriented stakeholders a number they can act on.
Note: All financial data are placeholders for demo purposes only.

And the tl;dr
What this prototype allowed us to discuss
The tool reframes the strategic conversation from "what's impressive" to "what's defensible." It gives decision-makers a concrete way to see that chasing novelty while leaving hidden work unsolved actively erodes subscription value by making third-party alternatives more attractive.
The shareable version that can be used by any company
- Ratios instead of absolutes: dollar totals became "team-weeks of payroll" or "Nx a baseline," and hours became "% of a workweek" or "Nx faster," so the shape of the loss reads without revealing rates or headcount
- Inline formula line: every reframed number sits above a small italic mono formula (e.g. hrs/wk × rate × team × months) so viewers see the model, not the inputs
- Conceptual, not literal formulas: formulas describe the relationship, never substitute real values, so nothing reverse-engineers back to a specific org
- Brand-specific inputs left intact: app picker still names real tools (Photoshop, Figma, Canva…) because those are user inputs, not output claims, and the AI competitive timeline stays as-is since it's public info